Machine Learning : k-Means Clustering II

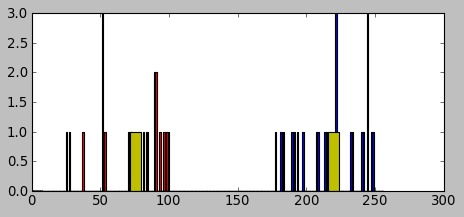
In the previous (K-Means Clustering I, we looked at how OpenCV clusters a 1-D data set.
Now we may want to how we can do the same to the data with multi-features.
The process of creating the data set is almost identical. In 1-D case, we used Numpy's random numbers:
x = np.random.randint(25,100,25)
That's 1-D. We can generate 2-D data like this:
x = np.random.randint(25,100,(25,2))
Now it's a two-column vector instead of a single column vector.
import numpy as np
import cv2
from matplotlib import pyplot as plt

X = np.random.randint(25,50,(25,2))  # (weight, height)
Y = np.random.randint(60,85,(25,2))
Z = np.vstack((X,Y))

# convert to np.float32
Z = np.float32(Z)

# define criteria and apply kmeans()
criteria = (cv2.TERM_CRITERIA_EPS + cv2.TERM_CRITERIA_MAX_ITER, 10, 1.0)
ret,label,center=cv2.kmeans(Z,2,None,criteria,10,cv2.KMEANS_RANDOM_CENTERS)

# Now separate the data, Note the ravel()
A = Z[label.ravel()==0]
B = Z[label.ravel()==1]

# Plot the data
plt.scatter(A[:,0],A[:,1])
plt.scatter(B[:,0],B[:,1],c = 'r')
plt.scatter(center[:,0],center[:,1],s = 80,c = 'y', marker = 's')
plt.xlabel('Height'),plt.ylabel('Weight')
plt.show()

The data is quite artificial, yet it shows the essence of the clustering.
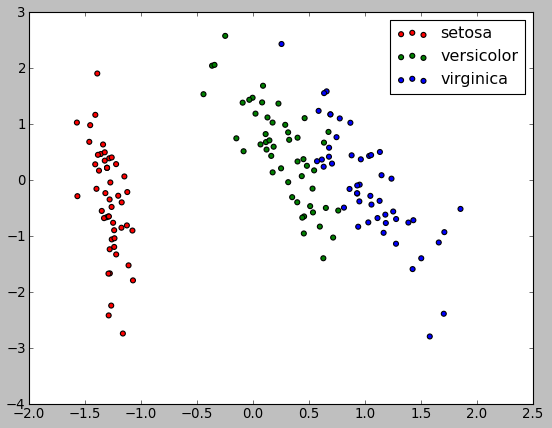
There is another Python package for Machine Learning and I recently starts to write tutorials on it. Please visit scikit-learn : Supervised_Learning_Unsupervised_Learning - e.g. Unsupervised PCA dimensionality reduction with iris dataset. May be I'm wrong, however, as far as I know, it appears the scikit-learn handles clustering much better than OpenCV.

Ph.D. / Golden Gate Ave, San Francisco / Seoul National Univ / Carnegie Mellon / UC Berkeley / DevOps / Deep Learning / Visualization