Signal Processing with NumPy arrays in iPython

IPython currently provides the following features (wiki-iPython):
- Powerful interactive shells (terminal and Qt-based).
- A browser-based notebook with support for code, text, mathematical expressions, inline plots and other rich media.
- Support for interactive data visualization and use of GUI toolkits.
- Flexible, embeddable interpreters to load into ones own projects.
- Easy to use, high performance tools for parallel computing.
We're not going deep into the signal processing but mainly focused on iPython and plot with very basic array operations.
We'll make a simple boxcar with np.zeros() and np.ones().
We start with a simple command to get python environment using ipython --pylab:
$ ipython --pylab
Python 2.7.5+ (default, Feb 27 2014, 19:37:08)
Type "copyright", "credits" or "license" for more information.

IPython 0.13.2 -- An enhanced Interactive Python.
?         -> Introduction and overview of IPython's features.
%quickref -> Quick reference.
help      -> Python's own help system.
object?   -> Details about 'object', use 'object?' for extra details.

Welcome to pylab, a matplotlib-based Python environment [backend: TkAgg].
For more information, type 'help(pylab)'.

In [1]:
Let's play with arrays first:
In [1]: zeros Out[1]:In [2]: zeros(100) Out[2]: array([ 0., 0., 0., 0., 0., 0., 0., 0., 0., 0., 0., 0., 0., 0., 0., 0., 0., 0., 0., 0., 0., 0., 0., 0., 0., 0., 0., 0., 0., 0., 0., 0., 0., 0., 0., 0., 0., 0., 0., 0., 0., 0., 0., 0., 0., 0., 0., 0., 0., 0., 0., 0., 0., 0., 0., 0., 0., 0., 0., 0., 0., 0., 0., 0., 0., 0., 0., 0., 0., 0., 0., 0., 0., 0., 0., 0., 0., 0., 0., 0., 0., 0., 0., 0., 0., 0., 0., 0., 0., 0., 0., 0., 0., 0., 0., 0., 0., 0., 0., 0.]) In [3]: ones(10) Out[3]: array([ 1., 1., 1., 1., 1., 1., 1., 1., 1., 1.])
Now, we want to concatenate these and make a boxcar:
Also, we we know more about the command, we can add '?' after the command. Then, it will show details about the command as well as some usage samples:
In [4]: concatenate?
The following information will be displayed in another window (I mean if we can close the help window (by typing 'q'), our command shell will reappear:
Type:       builtin_function_or_method
String Form:<built-in function concatenate>
Docstring:
concatenate((a1, a2, ...), axis=0)

Join a sequence of arrays together.

Parameters
----------
a1, a2, ... : sequence of array_like
    The arrays must have the same shape, except in the dimension
    corresponding to `axis` (the first, by default).
axis : int, optional
    The axis along which the arrays will be joined.  Default is 0.
Now, concatenation:
In [5]: concatenate ( (zeros(100), ones(30), zeros(100)) )
Out[5]:
array([ 0.,  0.,  0.,  0.,  0.,  0.,  0.,  0.,  0.,  0.,  0.,  0.,  0.,
        0.,  0.,  0.,  0.,  0.,  0.,  0.,  0.,  0.,  0.,  0.,  0.,  0.,
        0.,  0.,  0.,  0.,  0.,  0.,  0.,  0.,  0.,  0.,  0.,  0.,  0.,
        0.,  0.,  0.,  0.,  0.,  0.,  0.,  0.,  0.,  0.,  0.,  0.,  0.,
        0.,  0.,  0.,  0.,  0.,  0.,  0.,  0.,  0.,  0.,  0.,  0.,  0.,
        0.,  0.,  0.,  0.,  0.,  0.,  0.,  0.,  0.,  0.,  0.,  0.,  0.,
        0.,  0.,  0.,  0.,  0.,  0.,  0.,  0.,  0.,  0.,  0.,  0.,  0.,
        0.,  0.,  0.,  0.,  0.,  0.,  0.,  0.,  0.,  1.,  1.,  1.,  1.,
        1.,  1.,  1.,  1.,  1.,  1.,  1.,  1.,  1.,  1.,  1.,  1.,  1.,
        1.,  1.,  1.,  1.,  1.,  1.,  1.,  1.,  1.,  1.,  1.,  1.,  1.,
        0.,  0.,  0.,  0.,  0.,  0.,  0.,  0.,  0.,  0.,  0.,  0.,  0.,
        0.,  0.,  0.,  0.,  0.,  0.,  0.,  0.,  0.,  0.,  0.,  0.,  0.,
        0.,  0.,  0.,  0.,  0.,  0.,  0.,  0.,  0.,  0.,  0.,  0.,  0.,
        0.,  0.,  0.,  0.,  0.,  0.,  0.,  0.,  0.,  0.,  0.,  0.,  0.,
        0.,  0.,  0.,  0.,  0.,  0.,  0.,  0.,  0.,  0.,  0.,  0.,  0.,
        0.,  0.,  0.,  0.,  0.,  0.,  0.,  0.,  0.,  0.,  0.,  0.,  0.,
        0.,  0.,  0.,  0.,  0.,  0.,  0.,  0.,  0.,  0.,  0.,  0.,  0.,
        0.,  0.,  0.,  0.,  0.,  0.,  0.,  0.,  0.])
Actually, we want to assign the array to a variable:
In [6]: data  = concatenate ( (zeros(100), ones(30), zeros(100)) )

In [7]: plot(data)
Out[7]: [<matplotlib.lines.Line2D at 0x3024450>]
The we get the picture below:
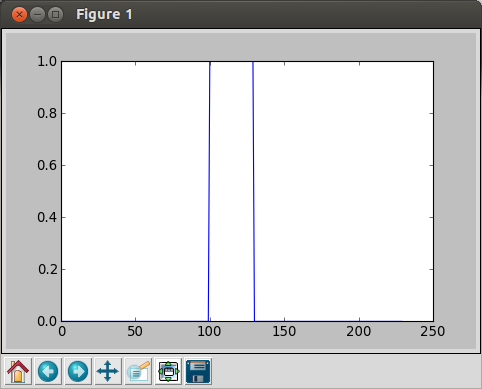
Note the values in the array is for y-values, for x-axis, the sample numbers are used: we have 100+30+100=230 samples.
In [8]: hamming(40)
Out[8]:
array([ 0.08      ,  0.08595688,  0.10367324,  0.13269023,  0.17225633,
        0.2213468 ,  0.27869022,  0.34280142,  0.41201997,  0.48455313,
        0.55852233,  0.63201182,  0.70311825,  0.77      ,  0.83092487,
        0.88431494,  0.92878744,  0.96319054,  0.98663324,  0.99850836,
        0.99850836,  0.98663324,  0.96319054,  0.92878744,  0.88431494,
        0.83092487,  0.77      ,  0.70311825,  0.63201182,  0.55852233,
        0.48455313,  0.41201997,  0.34280142,  0.27869022,  0.2213468 ,
        0.17225633,  0.13269023,  0.10367324,  0.08595688,  0.08      ])

In [9]: plot(hamming(40))
Out[9]: []
Then, we get the following picture:
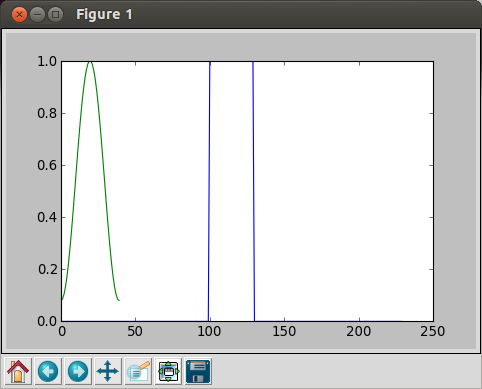
We overwrote a new to the old one because we did not close the plot window before we made a new draw.
So, let's close this window, and plot the Hamming again:
In [10]: plot(hamming(40))
Out[10]: []
Now, we have a plot with only the Hamming filter:
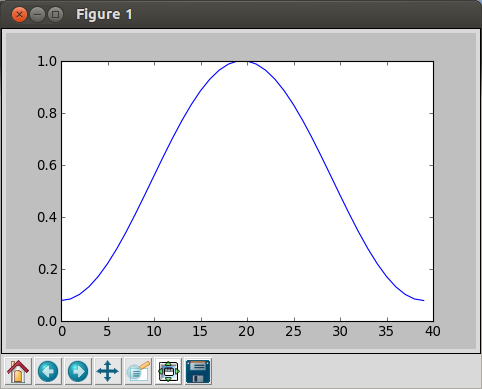
However, if we want to apply the filter to the other signal, we need to normalize the filter.
We'll normalize the filter by diving it by the sum of the filter values:
In [11]: sum(hamming(40))
Out[11]: 21.139999999999997

In [12]: norm = hamming(40) / sum(hamming(40))

In [13]: plot(norm)
Out[13]: []
The we get normalized Hamming filter:
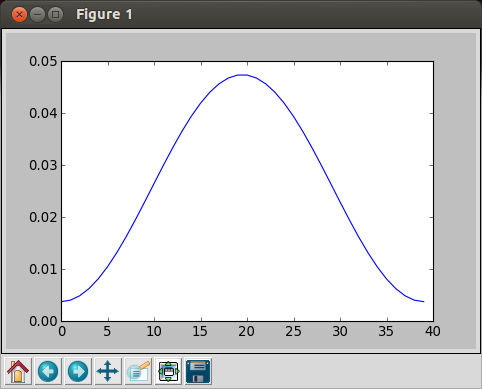
Note that the peak value is much lower than the previous Hamming filter.
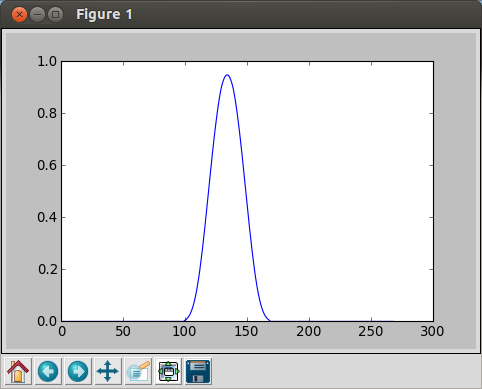
Now we do convolve the filter with the boxcar data:
In [14]: convolve(data, norm)
Out[14]:
array([ 0.        ,  0.        ,  0.        ,  0.        ,  0.        ,
        0.        ,  0.        ,  0.        ,  0.        ,  0.        ,
        0.        ,  0.        ,  0.        ,  0.        ,  0.        ,
        0.        ,  0.        ,  0.        ,  0.        ,  0.        ,
        0.        ,  0.        ,  0.        ,  0.        ,  0.        ,
        0.        ,  0.        ,  0.        ,  0.        ,  0.        ,
        0.        ,  0.        ,  0.        ,  0.        ,  0.        ,
        0.        ,  0.        ,  0.        ,  0.        ,  0.        ,
        0.        ,  0.        ,  0.        ,  0.        ,  0.        ,
        0.        ,  0.        ,  0.        ,  0.        ,  0.        ,
        0.        ,  0.        ,  0.        ,  0.        ,  0.        ,
        0.        ,  0.        ,  0.        ,  0.        ,  0.        ,
        0.        ,  0.        ,  0.        ,  0.        ,  0.        ,
        0.        ,  0.        ,  0.        ,  0.        ,  0.        ,
        0.        ,  0.        ,  0.        ,  0.        ,  0.        ,
        0.        ,  0.        ,  0.        ,  0.        ,  0.        ,
        0.        ,  0.        ,  0.        ,  0.        ,  0.        ,
        0.        ,  0.        ,  0.        ,  0.        ,  0.        ,
        0.        ,  0.        ,  0.        ,  0.        ,  0.        ,
        0.        ,  0.        ,  0.        ,  0.        ,  0.        ,
        0.0037843 ,  0.00785037,  0.0127545 ,  0.01903124,  0.0271796 ,
        0.03765012,  0.05083319,  0.06704896,  0.08653903,  0.10946018,
        0.13588035,  0.16577684,  0.19903693,  0.23546077,  0.27476658,
        0.31659794,  0.36053301,  0.40609548,  0.45276687,  0.5       ,
        0.54723313,  0.59390452,  0.63946699,  0.68340206,  0.72523342,
        0.76453923,  0.80096307,  0.83422316,  0.86411965,  0.89053982,
        0.90967668,  0.92510066,  0.93641231,  0.94331865,  0.94564081,
        0.94331865,  0.93641231,  0.92510066,  0.90967668,  0.89053982,
        0.86411965,  0.83422316,  0.80096307,  0.76453923,  0.72523342,
        0.68340206,  0.63946699,  0.59390452,  0.54723313,  0.5       ,
        0.45276687,  0.40609548,  0.36053301,  0.31659794,  0.27476658,
        0.23546077,  0.19903693,  0.16577684,  0.13588035,  0.10946018,
        0.08653903,  0.06704896,  0.05083319,  0.03765012,  0.0271796 ,
        0.01903124,  0.0127545 ,  0.00785037,  0.0037843 ,  0.        ,
        0.        ,  0.        ,  0.        ,  0.        ,  0.        ,
        0.        ,  0.        ,  0.        ,  0.        ,  0.        ,
        0.        ,  0.        ,  0.        ,  0.        ,  0.        ,
        0.        ,  0.        ,  0.        ,  0.        ,  0.        ,
        0.        ,  0.        ,  0.        ,  0.        ,  0.        ,
        0.        ,  0.        ,  0.        ,  0.        ,  0.        ,
        0.        ,  0.        ,  0.        ,  0.        ,  0.        ,
        0.        ,  0.        ,  0.        ,  0.        ,  0.        ,
        0.        ,  0.        ,  0.        ,  0.        ,  0.        ,
        0.        ,  0.        ,  0.        ,  0.        ,  0.        ,
        0.        ,  0.        ,  0.        ,  0.        ,  0.        ,
        0.        ,  0.        ,  0.        ,  0.        ,  0.        ,
        0.        ,  0.        ,  0.        ,  0.        ,  0.        ,
        0.        ,  0.        ,  0.        ,  0.        ,  0.        ,
        0.        ,  0.        ,  0.        ,  0.        ,  0.        ,
        0.        ,  0.        ,  0.        ,  0.        ,  0.        ,
        0.        ,  0.        ,  0.        ,  0.        ,  0.        ,
        0.        ,  0.        ,  0.        ,  0.        ,  0.        ,
        0.        ,  0.        ,  0.        ,  0.        ,  0.        ,
        0.        ,  0.        ,  0.        ,  0.        ])

In [15]:
If we plot, it looks like this:
We can also generate random signals.
In [16]: randn(20)
Out[16]:
array([ 1.04943265, -1.10655086,  2.65115344,  0.37216869, -1.81576411,
       -0.72413097, -0.74942176, -0.38411864,  0.04484577,  0.31172929,
       -0.78896659, -0.47319888, -0.61743916, -0.77453274, -2.34677579,
       -0.61554551,  0.93594151, -1.06451913, -1.13374368,  1.16034994])
If we do FFT with 100 random numbers:
In [17]: random_data = randn(100) In [18]: plot(fft.fft(random_data)) /usr/lib/python2.7/dist-packages/numpy/core/numeric.py:320: ComplexWarning: Casting complex values to real discards the imaginary part return array(a, dtype, copy=False, order=order) Out[18]: [] In [19]: plot(random_data) Out[19]: [ ] In [20]:
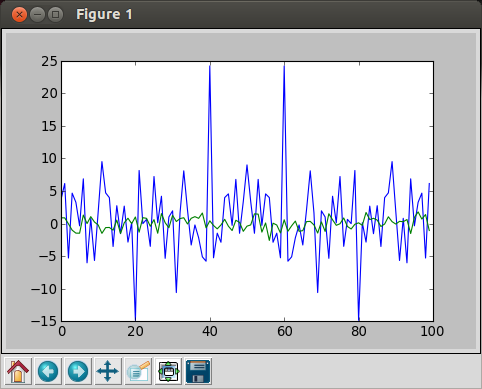
blue: FFT, green = random data
OpenCV 3 Tutorial
image & video processing
Installing on Ubuntu 13
Mat(rix) object (Image Container)
Creating Mat objects
The core : Image - load, convert, and save
Smoothing Filters A - Average, Gaussian
Smoothing Filters B - Median, Bilateral
OpenCV 3 image and video processing with Python
OpenCV 3 with Python
Image - OpenCV BGR : Matplotlib RGB
Basic image operations - pixel access
iPython - Signal Processing with NumPy
Signal Processing with NumPy I - FFT and DFT for sine, square waves, unitpulse, and random signal
Signal Processing with NumPy II - Image Fourier Transform : FFT & DFT
Inverse Fourier Transform of an Image with low pass filter: cv2.idft()
Image Histogram
Video Capture and Switching colorspaces - RGB / HSV
Adaptive Thresholding - Otsu's clustering-based image thresholding
Edge Detection - Sobel and Laplacian Kernels
Canny Edge Detection
Hough Transform - Circles
Watershed Algorithm : Marker-based Segmentation I
Watershed Algorithm : Marker-based Segmentation II
Image noise reduction : Non-local Means denoising algorithm
Image object detection : Face detection using Haar Cascade Classifiers
Image segmentation - Foreground extraction Grabcut algorithm based on graph cuts
Image Reconstruction - Inpainting (Interpolation) - Fast Marching Methods
Video : Mean shift object tracking
Machine Learning : Clustering - K-Means clustering I
Machine Learning : Clustering - K-Means clustering II
Machine Learning : Classification - k-nearest neighbors (k-NN) algorithm
Ph.D. / Golden Gate Ave, San Francisco / Seoul National Univ / Carnegie Mellon / UC Berkeley / DevOps / Deep Learning / Visualization