Visualization
- Fragment
A fragment is just a candidate to become a pixel but not yet.
After rasterization of points, lines, bitmaps (per vertex operation), we end up with some pixel-like data. To become a real pixel, it has to pass depth test. Also, the color data of the fragment may be changed by some blending (alpha-test). Only the fragments passed all the tests (per fragment operation) will survive, and be qualified for pixels. They are the ones that will be displayed on the screen. - Framebuffer
The frame buffer is graphics memory that stores the result of rendering operations. When we mention framebuffer, usually, we're referring to a graphic's cards memory (RAM). Whatever written to the framebuffer will show up on the screen, usually 24 times a second to achieve smooth animation. Note that there are two parts of the memory: front buffer(currently on display) and back buffer(will be display when the buffer swaps). - Rasterization
The rasterization is taking a 3D scene and rendering it onto a 2D surface in a form of a raster image (pixels) so that we can display it on a screen. Simply put, rasterization is the process of mapping from scene geometry to pixels. In the process, we use transformation, clipping, texturing, and shading. - Pixel
A pixel is the final output from all the processes. The pixel has final color information, and commonly contains 24 bits of information per pixel (2^24, or more than 16 million). Known as truecolor, 24-bit color can realistically depict color images. The number of bits stored in each pixel is known as the color depth. - Frame Buffer Object (FBO)
The results of rendering commands end up as pixels in a 2D image called a framebuffer. The default framebuffer is automatically drawn to the screen, but Framebuffer Objects (FBOs) provide a mechanism for users to supply an alternative, off-screen destination. Drawing off-screen enables a number of effects which are difficult or impossible otherwise. For example, imagine you want to blur the entire screen. By using an FBO, you can capture the result of your rendering commands before they hit the screen, process those pixels using a shader, and then draw the blurred pixels instead of the originals.
A framebuffer can also encapsulate more than just red-green-blue data per pixel. In fact by default OpenGL stores depth information, as well as alpha values, and so on. An FBO can also represent this additional information, allowing the storage and processing of alpha and depth information. Furthermore, all of this information can be used as textures in subsequent rendering. This technique is often called render-to-texture.
Usually, the FBO Objects are offscreen rendering targets. - Alpha Testing
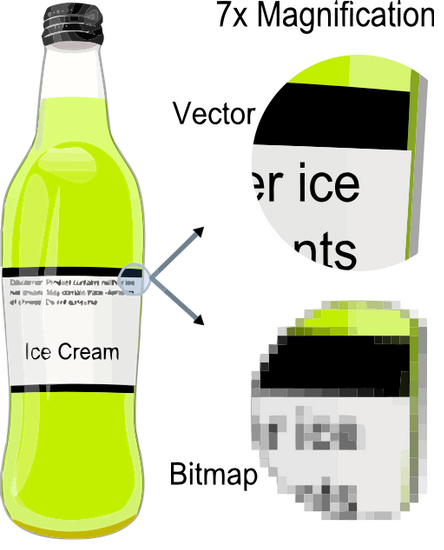
We use alpha testing to control when pixels are written to the render-target surface. If the test succeeds, the pixel is written. If it does not, the pixel is ignored. Usually, we set a reference alpha value which all pixels to compare against. The most common use for alpha testing is to improve performance when rasterizing objects that are nearly transparent. If the color data being rasterized is more opaque than the color at a given pixel, then the pixel is written. - Raster vs Vector Graphics

Picture source Wiki Media - Transformation Matrix Stacks

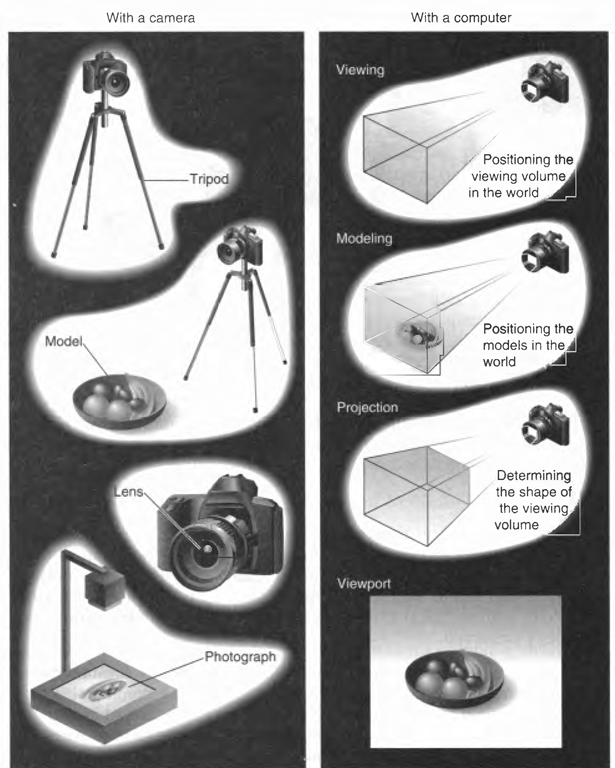
Picture source : OpenGL Programming Guide - Alpha Blending
"Alpha blending is the process of combining a translucent foreground color with a background color, thereby producing a new blended color. The degree of the foreground color's translucency may range from completely transparent to completely opaque. If the foreground color is completely transparent, the blended color will be the background color. Conversely, if it is completely opaque, the blended color will be the foreground color." - wiki,Blending occurs after the scene has been rasterized and converted to fragments, but just before the final pixels are drawn into the framebuffer.
The Visualization Toolkit (VTK) is an open-source, freely available software system for 3D computer graphics, image processing and visualization. VTK consists of a C++ class library and several interpreted interface layers including Tcl/Tk, Java, and Python. Kitware, whose team created and continues to extend the toolkit, offers professional support and consulting services for VTK. VTK supports a wide variety of visualization algorithms including: scalar, vector, tensor, texture, and volumetric methods; and advanced modeling techniques such as: implicit modeling, polygon reduction, mesh smoothing, cutting, contouring, and Delaunay triangulation. VTK has an extensive information visualization framework, has a suite of 3D interaction widgets, supports parallel processing, and integrates with various databases on GUI toolkits such as Qt and Tk. VTK is cross-platform and runs on Linux, Windows, Mac and Unix platforms.
-from http://www.vtk.org/
VTK is the basis of several advanced visualization applications such as: ParaView, VisIt, VisTrails, 3DSlicer, MayaVi, and OsiriX.
Architectural Features
Before getting too far into the specific architectural features of VTK, there are high-level concepts that have significant impact on developing and using the system. One of these is VTK's hybrid wrapper facility. This facility automatically generates language bindings to Python, Java, and Tcl from VTK's C++ implementation (additional languages could be and have been added). Most high-powered developers will work in C++. User and application developers may use C++ but often the interpreted languages mentioned above are preferred. This hybrid compiled/interpreted environment combines the best of both worlds: high performance compute-intensive algorithms and flexibility when prototyping or developing applications. In fact this approach to multi-language computing has found favor with many in the scientific computing community and they often use VTK as a template for developing their own software.
In terms of software process, VTK has adopted CMake to control the build; CDash/CTest for testing; and CPack for cross-platform deployment. Indeed VTK can be compiled on almost any computer including supercomputers which are often notoriously primitive development environments. In addition, web pages, wiki, mailing lists (user and developer), documentation generation facilities (i.e., Doxygen) and a bug tracker (Mantis) round out the development tools. - from http://www.aosabook.org/en/vtk.html
Pros and Cons of VTK: http://cgg.mff.cuni.cz/trac/morpho/wiki/VTK.
(+) creation and manipulation of geometrical data
(+) efficient image processing (parallel implementation)
(+) interactive data visualization
(+) portable multi-threading and distributed memory for parallel algorithms
(+) from interpreted languages (e.g. Python)
(+) Interactive Viewer/Renderer "3D Widgets" for interacting with data
(++) architecture/visualization pipeline - visualization network
(+) distributed, implicit update process - objects have internal timestamp,
system detects, with parts of the network have to be actualized
(+) reference counting - process obj.s able to share data obj.s w/ economic memory usage
(-) Very large...not a toy...you'll need a decent system to use it effectively
(-) Not a super-fast graphics engine...VTK uses C++ dynamic binding
and a device independent graphics model.
(-) memory hog (not as bad as MATLAB!)
(-) producing graphs (use Excel or MATLAB)
(-) linear algebra (use MATLAB or Python)
(-) VTK is rumored to have a steep learning curve
(-) unfamiliar class naming convention & workflow

ParaView is an open-source, multi-platform data analysis and visualization application. ParaView users can quickly build visualizations to analyze their data using qualitative and quantitative techniques. The data exploration can be done interactively in 3D or programmatically using ParaView's batch processing capabilities.
ParaView was developed to analyze extremely large datasets using distributed memory computing resources. It can be run on supercomputers to analyze datasets of terascale as well as on laptops for smaller data.
The Mayavi scientific data 3-dimensional visualizer.
The Mayavi project includes two related packages for 3-dimensional visualization:
- Mayavi2: A tool for easy and interactive visualization of data.
- TVTK: A Traits-based wrapper for the Visualization Toolkit, a popular open-source visualization library.
From http://mariovalle.name/visualization/tools.html
- Paraview
Very good end-user tool for 3D scientific visualization.
The only drawback is that is quite complex to customize. - VTK
Very complete and powerful library for 3D scientific visualization.
It is not an end-user tool, it is a development package.
But scripting language interface make possible to experiment with it rather quickly. - Mayavi
It is quite good and simple to use.
Needs only some more example data file to experiment with.
From http://wiki.python.org/moin/NumericAndScientific
- VTK
VTK is an open source, freely available software system for 3D computer graphics,
image processing, and visualization used by thousands of researchers and developers around the world.
It has a very good python interface. - Mayavi
application and library for interactive visualization in 3D of scientific data.
High level and targeted toward the end user/application developer. - VisTrails
VisTrails is an open-source scientific workflow and provenance management system developed at the University of Utah that provides support for data exploration and visualization. - matplotlib
matplotlib is a python 2D plotting library which produces publication quality figures in a variety of hardcopy formats and interactive environments across platforms.
matplotlib can be used in python scripts, the python and ipython shell (ala matlab or mathematica), web application servers, and six graphical user interface toolkits.
-
Info on MATLAB, VTK, ParaView, etc.
http://www.bu.edu/tech/research/training/tutorials/ -
Python - Python related visualization tools
Ph.D. / Golden Gate Ave, San Francisco / Seoul National Univ / Carnegie Mellon / UC Berkeley / DevOps / Deep Learning / Visualization