Data Visualization Tools - 2015
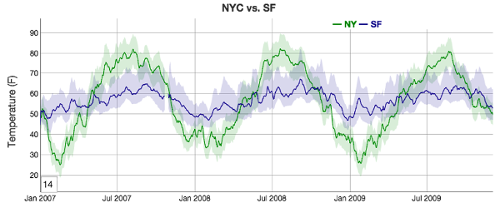
dygraphs is a fast, flexible open source JavaScript charting library.
The chart is interactive: we can mouse over to highlight individual values. We can click and drag to zoom. Double-clicking will zoom us back out. Shift-drag will pan. We can change the number and hit enter to adjust the averaging period.
It allows users to explore and interpret dense data sets. Here's how it works:
Javascript...
new Dygraph(div, "ny-vs-sf.txt", {
  legend: 'always',
  title: 'NYC vs. SF',
  showRoller: true,
  rollPeriod: 14,
  customBars: true,
  ylabel: 'Temperature (F)',
});
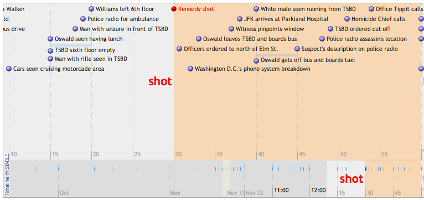
Web Widget for Visualizing Temporal Data With this widget, we can make beautiful interactive timelines like the one below. Try dragging it horizontally or using our mouse-wheel. Click on each event for more details.
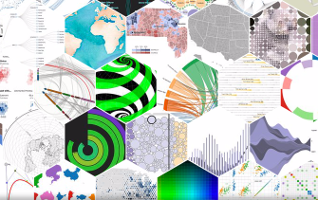
D3.js is a JavaScript library for manipulating documents based on data. D3 helps we bring data to life using HTML, SVG, and CSS. D3's emphasis on web standards gives us the full capabilities of modern browsers without tying to a proprietary framework, combining powerful visualization components and a data-driven approach to DOM manipulation.
Download the latest version (3.5.5) here:
D3 allows us to bind arbitrary data to a Document Object Model (DOM), and then apply data-driven transformations to the document. For example, we can use D3 to generate an HTML table from an array of numbers. Or, use the same data to create an interactive SVG bar chart with smooth transitions and interaction.
D3 is not a monolithic framework that seeks to provide every conceivable feature. Instead, D3 solves the crux of the problem: efficient manipulation of documents based on data. This avoids proprietary representation and affords extraordinary flexibility, exposing the full capabilities of web standards such as HTML, SVG, and CSS. With minimal overhead, D3 is extremely fast, supporting large datasets and dynamic behaviors for interaction and animation. D3's functional style allows code reuse through a diverse collection of components and plugins.
Visualize our data in 6 different ways. Each of them animated, with a load of customisation options and interactivity extensions. Chart.js uses the HTML5 canvas element. It's supported in all modern browsers. Chart.js provides default simple support for canvas tooltips on hover/touch, but WE can extend chart interactions to trigger events in our application.
Chart.js will resize our chart if the browser changes size, along with providing the perfect scale granularity for that size. Chart.js is modular, and each of the chart types have been split up, so we can load only which chart types we need for our project. Chart.js provides default simple support for canvas tooltips on hover/touch, but we can extend chart interactions to trigger events in our application.
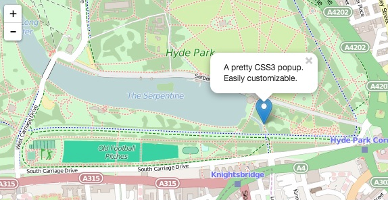
Leaflet is a modern open-source JavaScript library for mobile-friendly interactive maps. It is developed by Vladimir Agafonkin with a team of dedicated contributors. Weighing just about 33 KB of JS, it has all the features most developers ever need for online maps.
Leaflet is designed with simplicity, performance and usability in mind. It works efficiently across all major desktop and mobile platforms out of the box, taking advantage of HTML5 and CSS3 on modern browsers while still being accessible on older ones. It can be extended with a huge amount of plugins, has a beautiful, easy to use and well-documented API and a simple, readable source code that is a joy to contribute to.
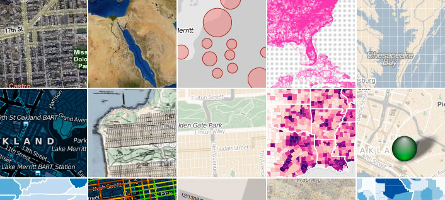
Polymaps provides speedy display of multi-zoom datasets over maps, and supports a variety of visual presentations for tiled vector data, in addition to the usual cartography from OpenStreetMap, CloudMade, Bing, and other providers of image-based web maps.
Because Polymaps can load data at a full range of scales, it's ideal for showing information from country level on down to states, cities, neighborhoods, and individual streets. Because Polymaps uses SVG (Scalable Vector Graphics) to display information, we can use familiar, comfortable CSS rules to define the design of our data. And because Polymaps uses the well known spherical mercator tile format for its imagery and its data, publishing information is a snap.
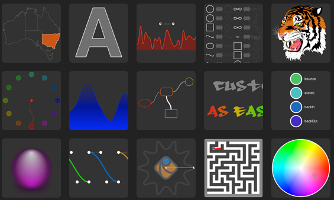
Raphael is a small JavaScript library that should simplify our work with vector graphics on the web. If we want to create our own specific chart or image crop and rotate widget, for example, we can achieve it simply and easily with this library.
Raphael uses the SVG W3C Recommendation and VML as a base for creating graphics. This means every graphical object we create is also a DOM object, so we can attach JavaScript event handlers or modify them later. Raphael's goal is to provide an adapter that will make drawing vector art compatible cross-browser and easy.
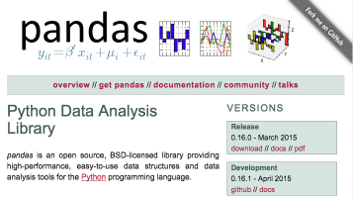
Python Data Analysis Library
Pandas is an open source, BSD-licensed library providing high-performance, easy-to-use data structures and data analysis tools for the Python programming language.
matplotlib is a python 2D plotting library which produces publication quality figures in a variety of hardcopy formats and interactive environments across platforms. matplotlib can be used in python scripts, the python and ipython shell (ala MATLAB or Mathematica), web application servers, and six graphical user interface toolkits.
Processing is a programming language, development environment, and online community. Since 2001, Processing has promoted software literacy within the visual arts and visual literacy within technology. Initially created to serve as a software sketchbook and to teach computer programming fundamentals within a visual context, Processing evolved into a development tool for professionals. Today, there are tens of thousands of students, artists, designers, researchers, and hobbyists who use Processing for learning, prototyping, and production.
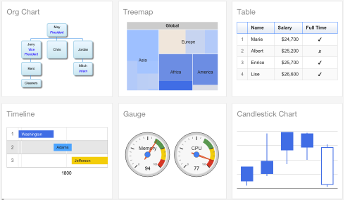
Unlike Google Fusion Tables, which is a full-fledged, self-contained application for uploading and storing data, and generating charts and maps, Chart Tools is designed to visualize data residing elsewhere, such as your own website or within Google Docs.
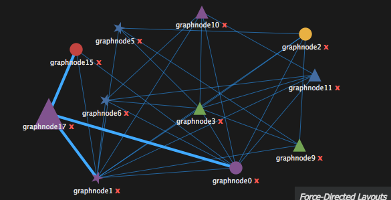
InfoVis is probably not among the best known JavaScript visualization libraries, but it's definitely worth a look if interested in publishing interactive data visualizations on the Web.
Ph.D. / Golden Gate Ave, San Francisco / Seoul National Univ / Carnegie Mellon / UC Berkeley / DevOps / Deep Learning / Visualization
