Docker - ELK 7.6 : Kibana Part 2

Elastic Stack docker/kubernetes series:
Note: continued from Docker - ELK 7.6 : Kibana Part 1.
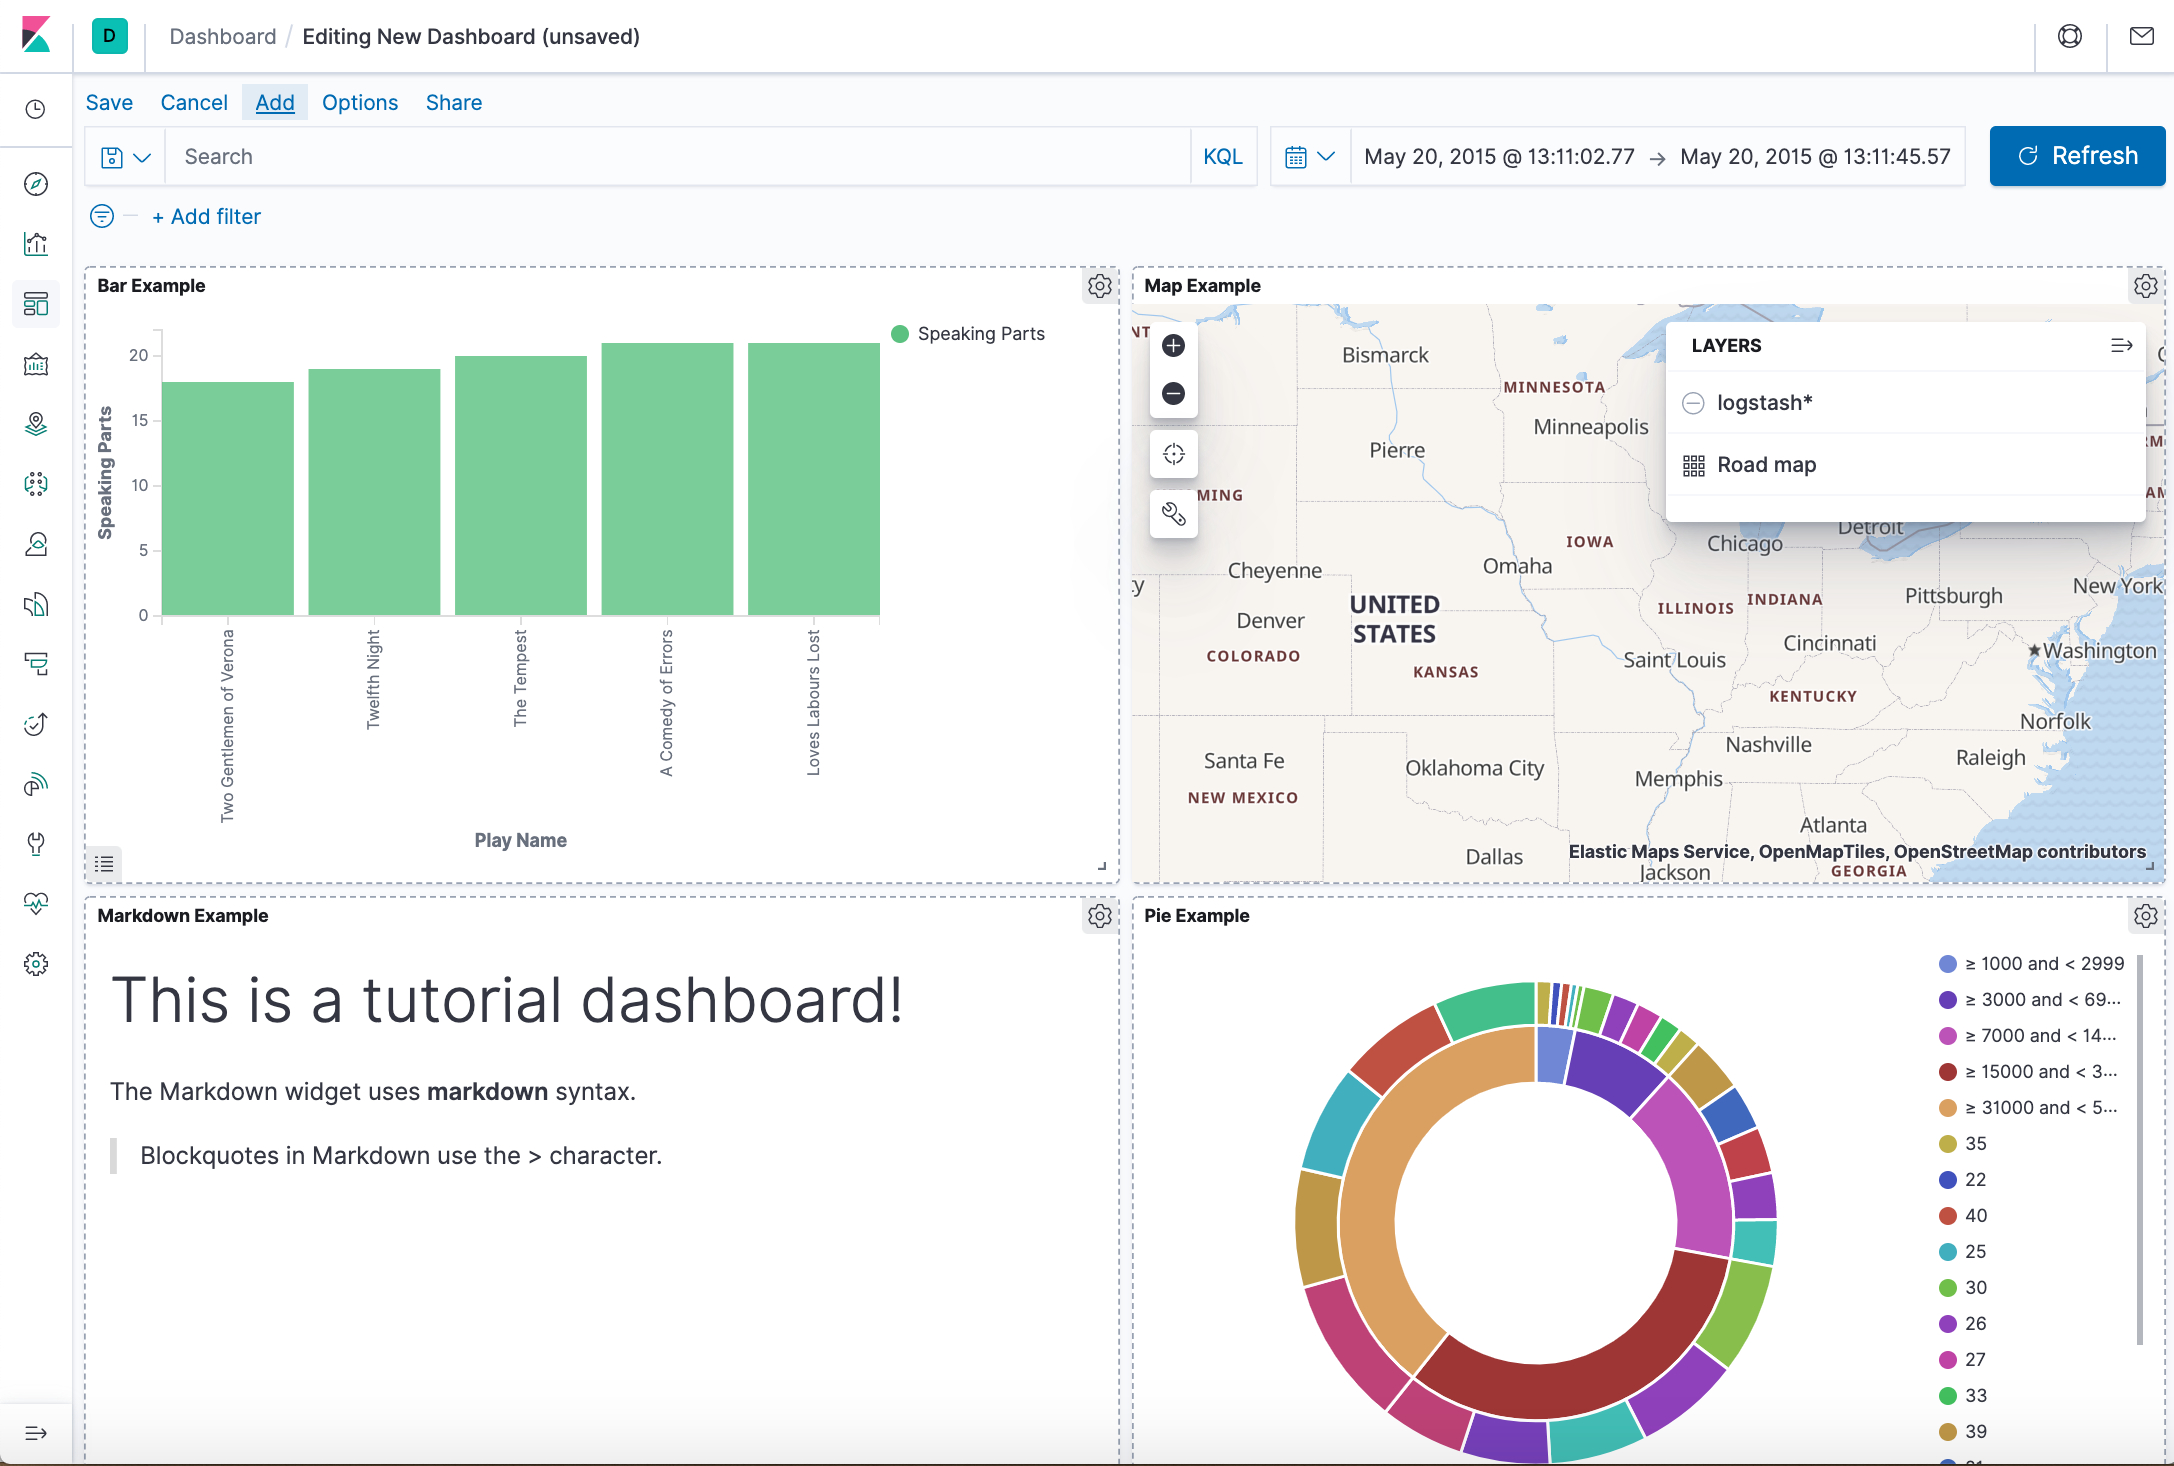
The dashboard below is the one we'll be building:
This tutorial requires us to download three data sets:
- The complete works of William Shakespeare, suitably parsed into fields
- A set of fictitious accounts with randomly generated data
- A set of randomly generated log files
Because it requires bigger memory (256m=>512m), we need to modify docker-compose.yml:
ES_JAVA_OPTS: "-Xmx512m -Xms512m"
Then, run the stack again:
$ docker-compose down; docker-compose up
Create a new working directory where we want to download the files. From that directory, run the following commands:
$ curl -O https://download.elastic.co/demos/kibana/gettingstarted/8.x/shakespeare.json
$ curl -O https://download.elastic.co/demos/kibana/gettingstarted/8.x/accounts.zip
$ curl -O https://download.elastic.co/demos/kibana/gettingstarted/8.x/logs.jsonl.gz
Two of the data sets are compressed. To extract the files, use these commands:
$ unzip accounts.zip
$ gunzip logs.jsonl.gz
The Shakespeare data set (shakespeare.json) has this structure:
{
    "line_id": INT,
    "play_name": "String",
    "speech_number": INT,
    "line_number": "String",
    "speaker": "String",
    "text_entry": "String",
}
The accounts data set (accounts.json) has this structure:
{
    "line_id": INT,
    "play_name": "String",
    "speech_number": INT,
    "line_number": "String",
    "speaker": "String",
    "text_entry": "String",
}
The logs data set (logs.jsonl) has dozens of different fields. Here are the notable fields for this tutorial:
{
    "memory": INT,
    "geo.coordinates": "geo_point"
    "@timestamp": "date"
}
Before we load the Shakespeare and logs data sets, we must set up mappings for the fields. Mappings divide the documents in the index into logical groups and specify the characteristics of the fields. These characteristics include the searchability of the field and whether it's tokenized, or broken up into separate words.
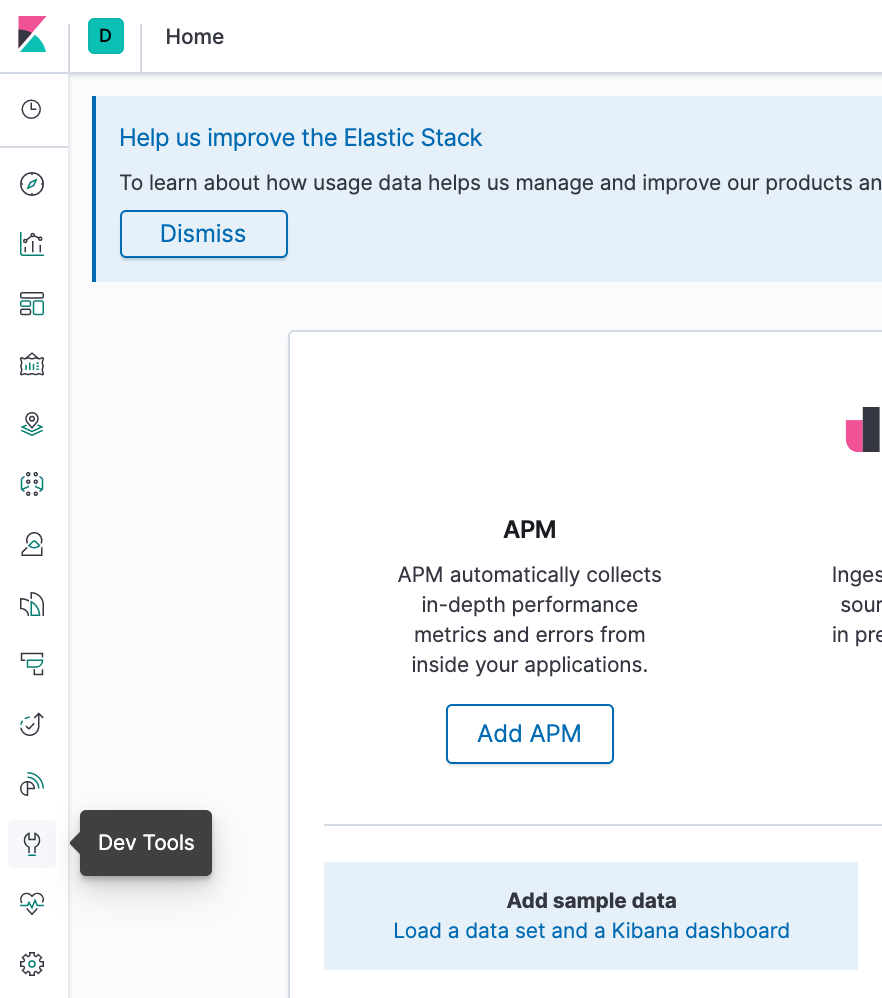
In Kibana Dev Tools > Console
set up a mapping for the Shakespeare data set:
PUT /shakespeare
{
  "mappings": {
    "properties": {
    "speaker": {"type": "keyword"},
    "play_name": {"type": "keyword"},
    "line_id": {"type": "integer"},
    "speech_number": {"type": "integer"}
    }
  }
}
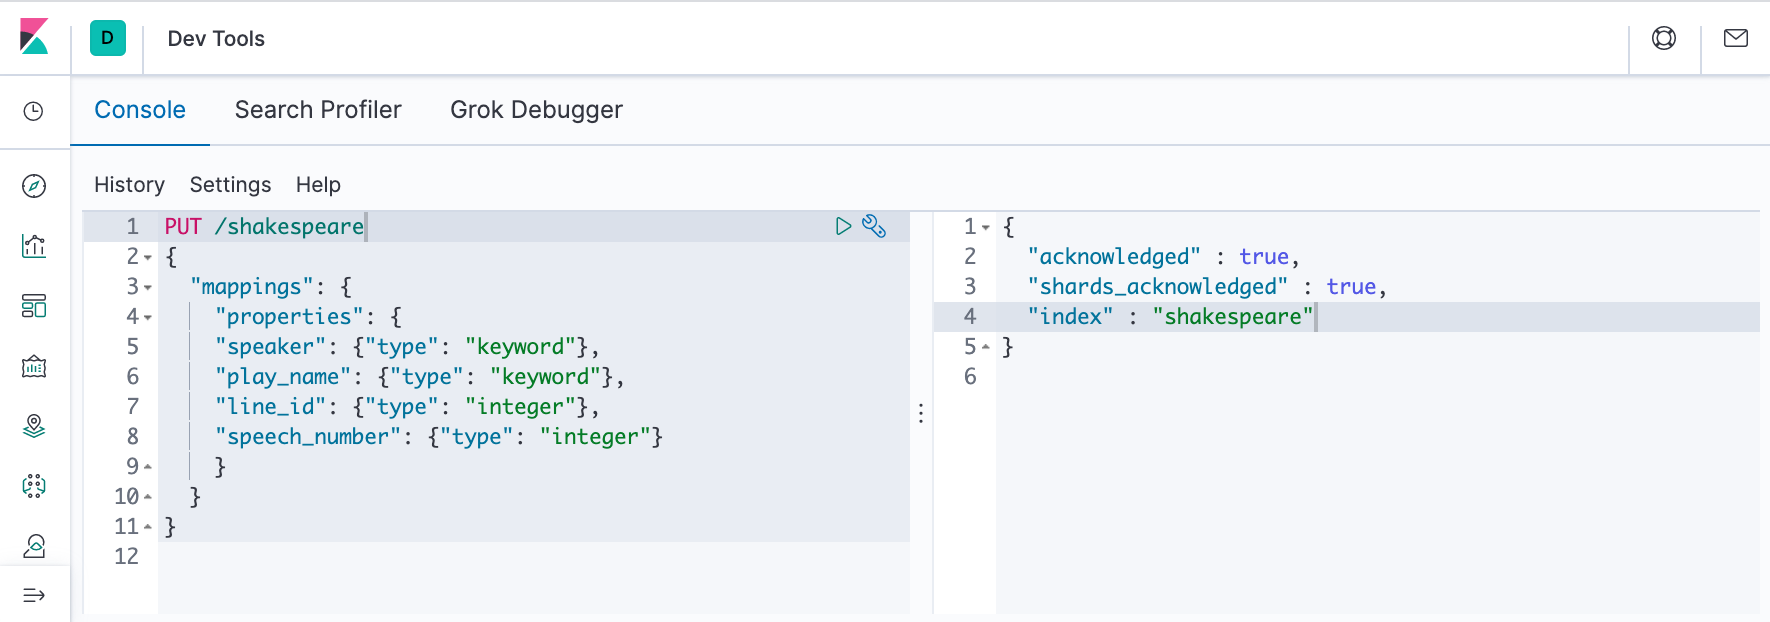
This mapping specifies field characteristics for the data set:
- The speaker and play_name fields are keyword fields. These fields are not analyzed. The strings are treated as a single unit even if they contain multiple words.
- The line_id and speech_number fields are integers.
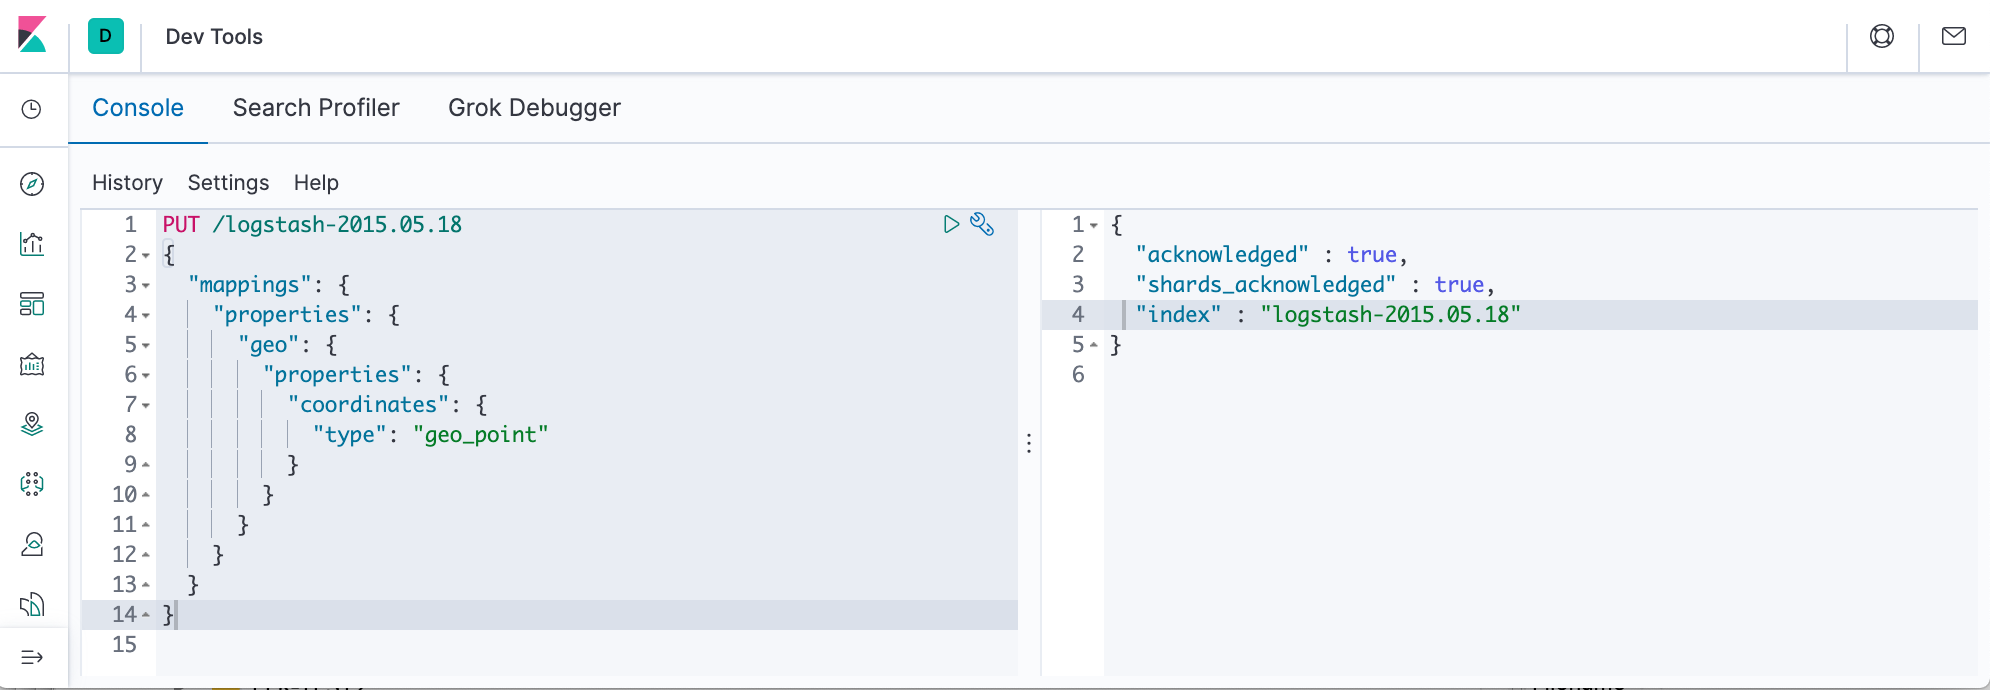
The logs data set requires a mapping to label the latitude and longitude pairs as geographic locations by applying the geo_point type.
PUT /logstash-2015.05.18
{
  "mappings": {
    "properties": {
      "geo": {
        "properties": {
          "coordinates": {
            "type": "geo_point"
          }
        }
      }
    }
  }
}
PUT /logstash-2015.05.19
{
  "mappings": {
    "properties": {
      "geo": {
        "properties": {
          "coordinates": {
            "type": "geo_point"
          }
        }
      }
    }
  }
}
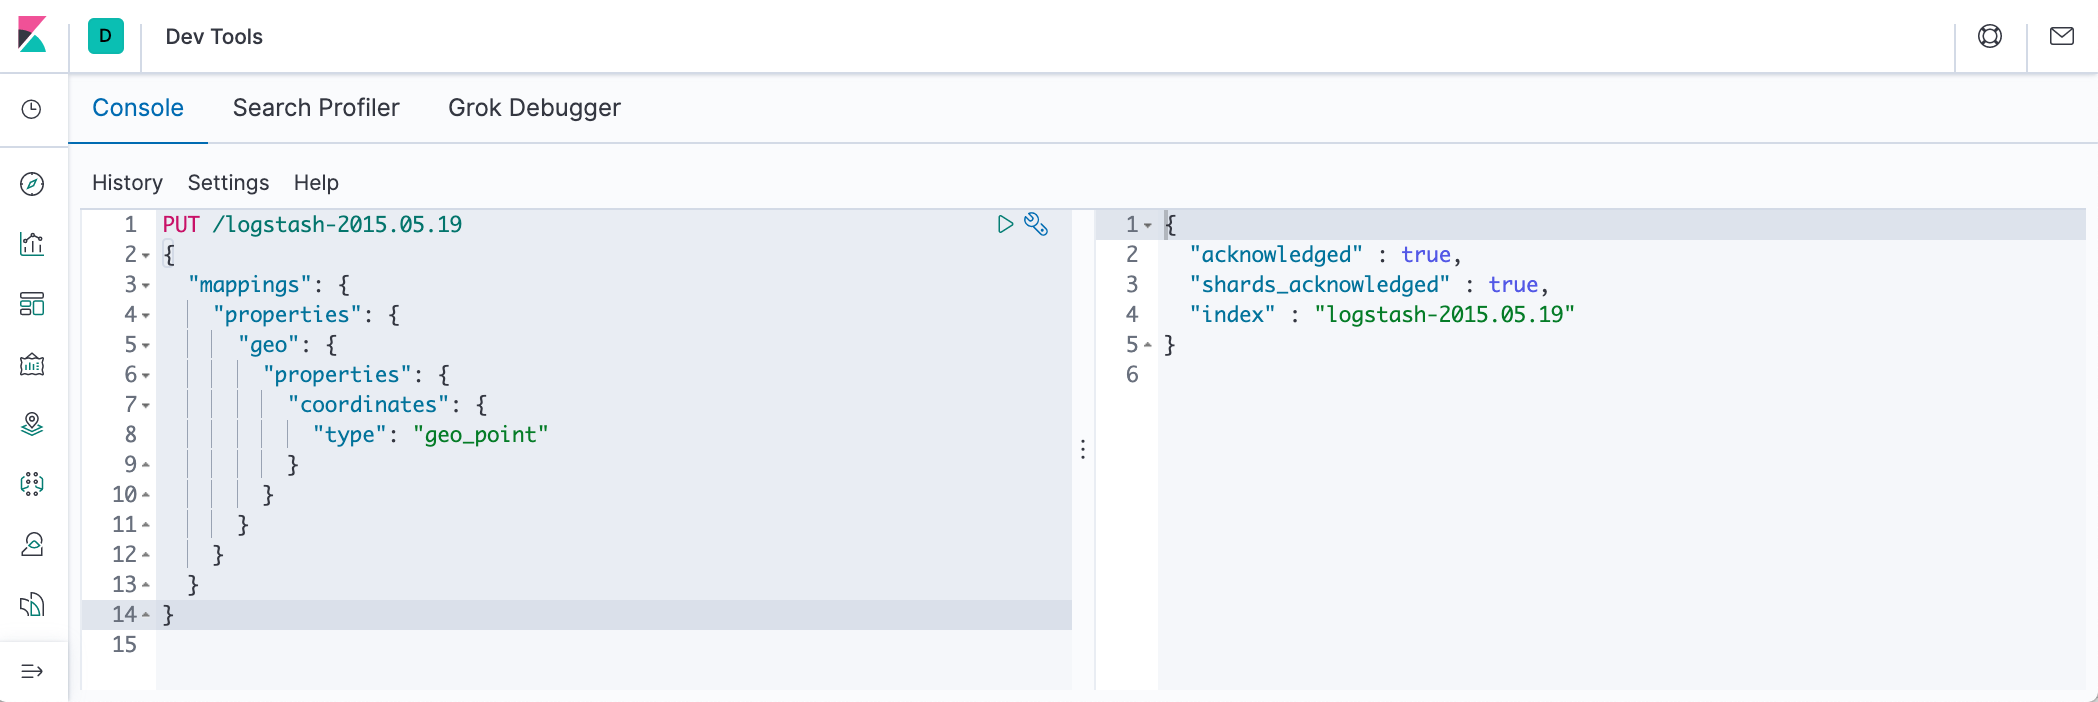
PUT /logstash-2015.05.20
{
  "mappings": {
    "properties": {
      "geo": {
        "properties": {
          "coordinates": {
            "type": "geo_point"
          }
        }
      }
    }
  }
}
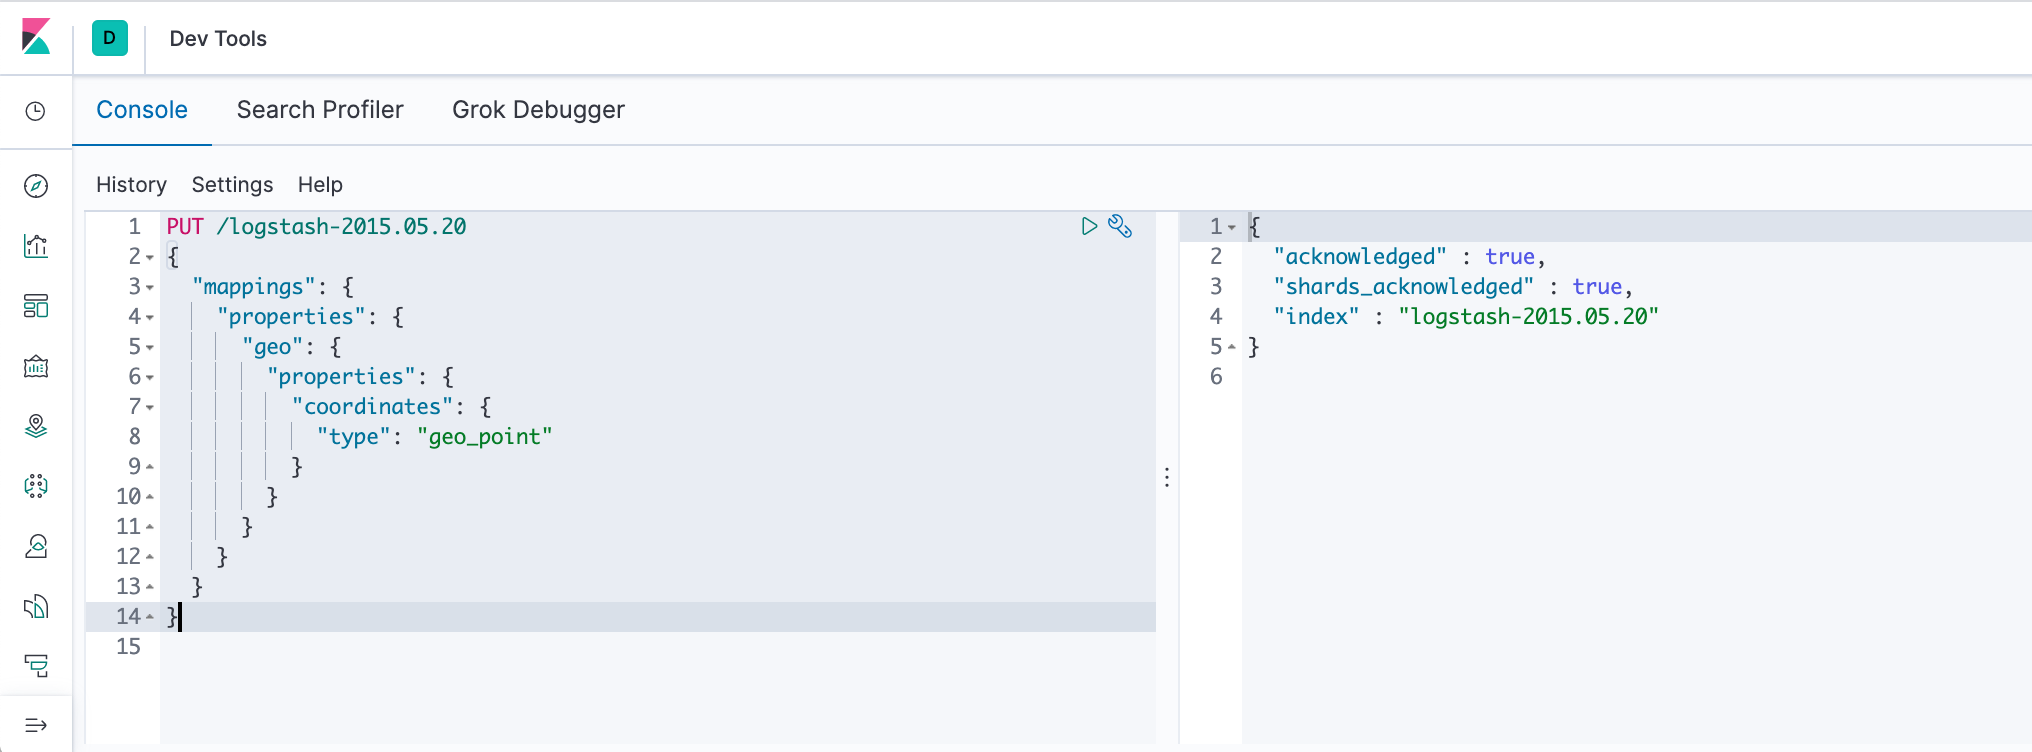
Not: the accounts data set doesn’t require any mappings.
At this point, we're ready to use the Elasticsearch bulk API to load the data sets via the ndjson (newline delimited json) format :
curl -u elastic -H 'Content-Type: application/x-ndjson' -XPOST '<host>:<port>/bank/_bulk?pretty' --data-binary @accounts.json
curl -u elastic -H 'Content-Type: application/x-ndjson' -XPOST '<host>:<port>/shakespeare/_bulk?pretty' --data-binary @shakespeare.json
curl -u elastic -H 'Content-Type: application/x-ndjson' -XPOST '<host>:<port>/_bulk?pretty' --data-binary @logs.jsonl
which are in our case:
$ curl -u elastic -H 'Content-Type: application/x-ndjson' -XPOST 'localhost:9200/bank/_bulk?pretty' --data-binary @accounts.json
Enter host password for user 'elastic':
{
  "took" : 439,
  "errors" : false,
  "items" : [
    {
      "index" : {
        "_index" : "bank",
        "_type" : "_doc",
        "_id" : "1",
        "_version" : 1,
        "result" : "created",
        "_shards" : {
          "total" : 2,
          "successful" : 1,
          "failed" : 0
        },
        "_seq_no" : 0,
        "_primary_term" : 1,
        "status" : 201
      }
    },
    ...
        {
      "index" : {
        "_index" : "bank",
        "_type" : "_doc",
        "_id" : "995",
        "_version" : 1,
        "result" : "created",
        "_shards" : {
          "total" : 2,
          "successful" : 1,
          "failed" : 0
        },
        "_seq_no" : 999,
        "_primary_term" : 1,
        "status" : 201
      }
    }
  ]
}

$ curl -u elastic -H 'Content-Type: application/x-ndjson' -XPOST 'localhost:9200/shakespeare/_bulk?pretty' --data-binary @shakespeare.json
Enter host password for user 'elastic':
{
  "took" : 54265,
  "errors" : false,
  "items" : [
    {
      "index" : {
        "_index" : "shakespeare",
        "_type" : "_doc",
        "_id" : "0",
        "_version" : 1,
        "result" : "created",
        "_shards" : {
          "total" : 2,
          "successful" : 1,
          "failed" : 0
        },
        "_seq_no" : 0,
        "_primary_term" : 1,
        "status" : 201
      }
    },
    ...
    {
      "index" : {
        "_index" : "shakespeare",
        "_type" : "_doc",
        "_id" : "111395",
        "_version" : 1,
        "result" : "created",
        "_shards" : {
          "total" : 2,
          "successful" : 1,
          "failed" : 0
        },
        "_seq_no" : 111395,
        "_primary_term" : 1,
        "status" : 201
      }
    }
  ]
}

$ curl -u elastic -H 'Content-Type: application/x-ndjson' -XPOST 'localhost:9200/_bulk?pretty' --data-binary @logs.jsonl
Enter host password for user 'elastic':
{
  "took" : 18781,
  "errors" : false,
  "items" : [
    {
      "index" : {
        "_index" : "logstash-2015.05.18",
        "_type" : "_doc",
        "_id" : "kJR4cXEBflJq7rOnFcHC",
        "_version" : 1,
        "result" : "created",
        "_shards" : {
          "total" : 2,
          "successful" : 1,
          "failed" : 0
        },
        "_seq_no" : 0,
        "_primary_term" : 1,
        "status" : 201
      }
    },
    ...
    {
      "index" : {
        "_index" : "logstash-2015.05.20",
        "_type" : "_doc",
        "_id" : "RJR4cXEBflJq7rOnFvjH",
        "_version" : 1,
        "result" : "created",
        "_shards" : {
          "total" : 2,
          "successful" : 1,
          "failed" : 0
        },
        "_seq_no" : 4749,
        "_primary_term" : 1,
        "status" : 201
      }
    }
  ]
}
The commands require user/pass (=elastic/changeme).
Note also we used --data-binary and it posts data exactly as specified with no extra processing whatsoever while --data or -d sends the specified data in a POST request to the HTTP server, in the same way that a browser does when a user has filled in an HTML form and presses the submit button. This will cause curl to pass the data to the server using the content-type application/x-www-form-urlencoded.
These commands might take some time to execute, depending on the available computing resources. Verify successful loading:
$ curl -X GET "localhost:9200/_cat/indices?v&pretty"
health status index                             uuid                   pri rep docs.count docs.deleted store.size pri.store.size
green  open   .monitoring-kibana-7-2020.04.13   WOLVjTHoTFCUIvnTTZu4-A   1   0          5            0    124.5kb        124.5kb
green  open   .monitoring-logstash-7-2020.04.13 b43BCik-SiGdvqT9PG9LzA   1   0         13            0    229.9kb        229.9kb
green  open   .apm-agent-configuration          JUka-5_KTEy2Bl9RL6G2Jg   1   0          0            0       283b           283b
green  open   .monitoring-es-7-2020.04.13       Hoe8zupVROWPoH9iu_ohPQ   1   0      12042         8584      5.7mb          5.7mb
yellow open   logstash-2015.05.20               wamWuTcbQPKbM8GtXX0k9g   1   1       4750            0     16.3mb         16.3mb
green  open   .kibana_1                         Ap4W0LRrTE6zFoiZoU1thg   1   0          6            0     19.2kb         19.2kb
yellow open   bank                              yAPhAGD1SU-RKkE-9K5N-g   1   1       1000            0    414.1kb        414.1kb
green  open   .kibana_task_manager_1            2u_N047ZQkacx-zHLFPIZw   1   0          2            1     51.5kb         51.5kb
green  open   ilm-history-1-000001              NYk4iKbVQTu_scOIe-ezig   1   0         48            0     58.3kb         58.3kb
yellow open   logstash-2020.04.13-000001        OLtmxHmtTyybWJohPbWXJA   1   1          0            0       283b           283b
yellow open   shakespeare                       5Z9B0M15Qv2LRLmBHrEDMw   1   1     111396            0     21.5mb         21.5mb
yellow open   logstash-2015.05.18               I8Dsy-_yRrK81V4DyDqO5w   1   1       4631            0     16.3mb         16.3mb
yellow open   logstash-2015.05.19               1n_-xYVYTx-zIM8y3Pwqxg   1   1       4624            0     16.4mb         16.4mb
Index patterns tell Kibana which Elasticsearch indices we want to explore. An index pattern can match the name of a single index, or include a wildcard (*) to match multiple indices.
For example, Logstash typically creates a series of indices in the format logstash-YYYY.MM.DD. To explore all of the log data from May 2018, we could specify the index pattern logstash-2018.05*.
First we'll create index patterns for the Shakespeare data set, which has an index named shakespeare, and the accounts data set, which has an index named bank. These data sets don't contain time series data.
- In Kibana, open Management, and then click Index Patterns.
- If this is the first index pattern, the Create index pattern page opens automatically. Otherwise, click Create index pattern.
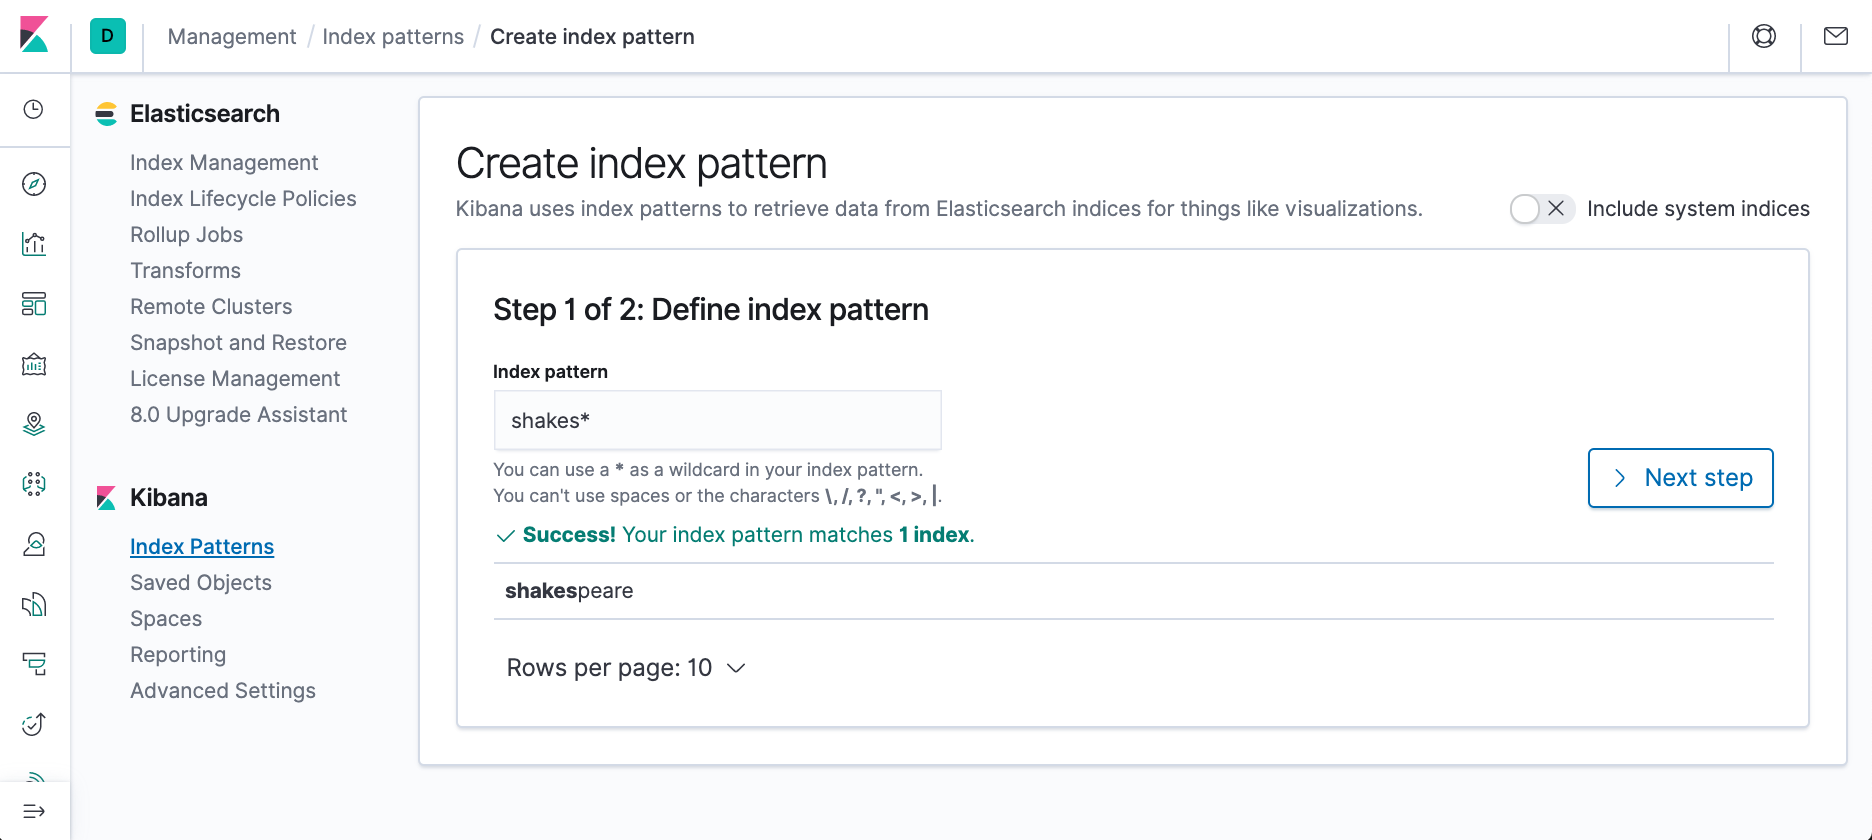
- Enter shakes* in the Index pattern field.
- Click Next step.
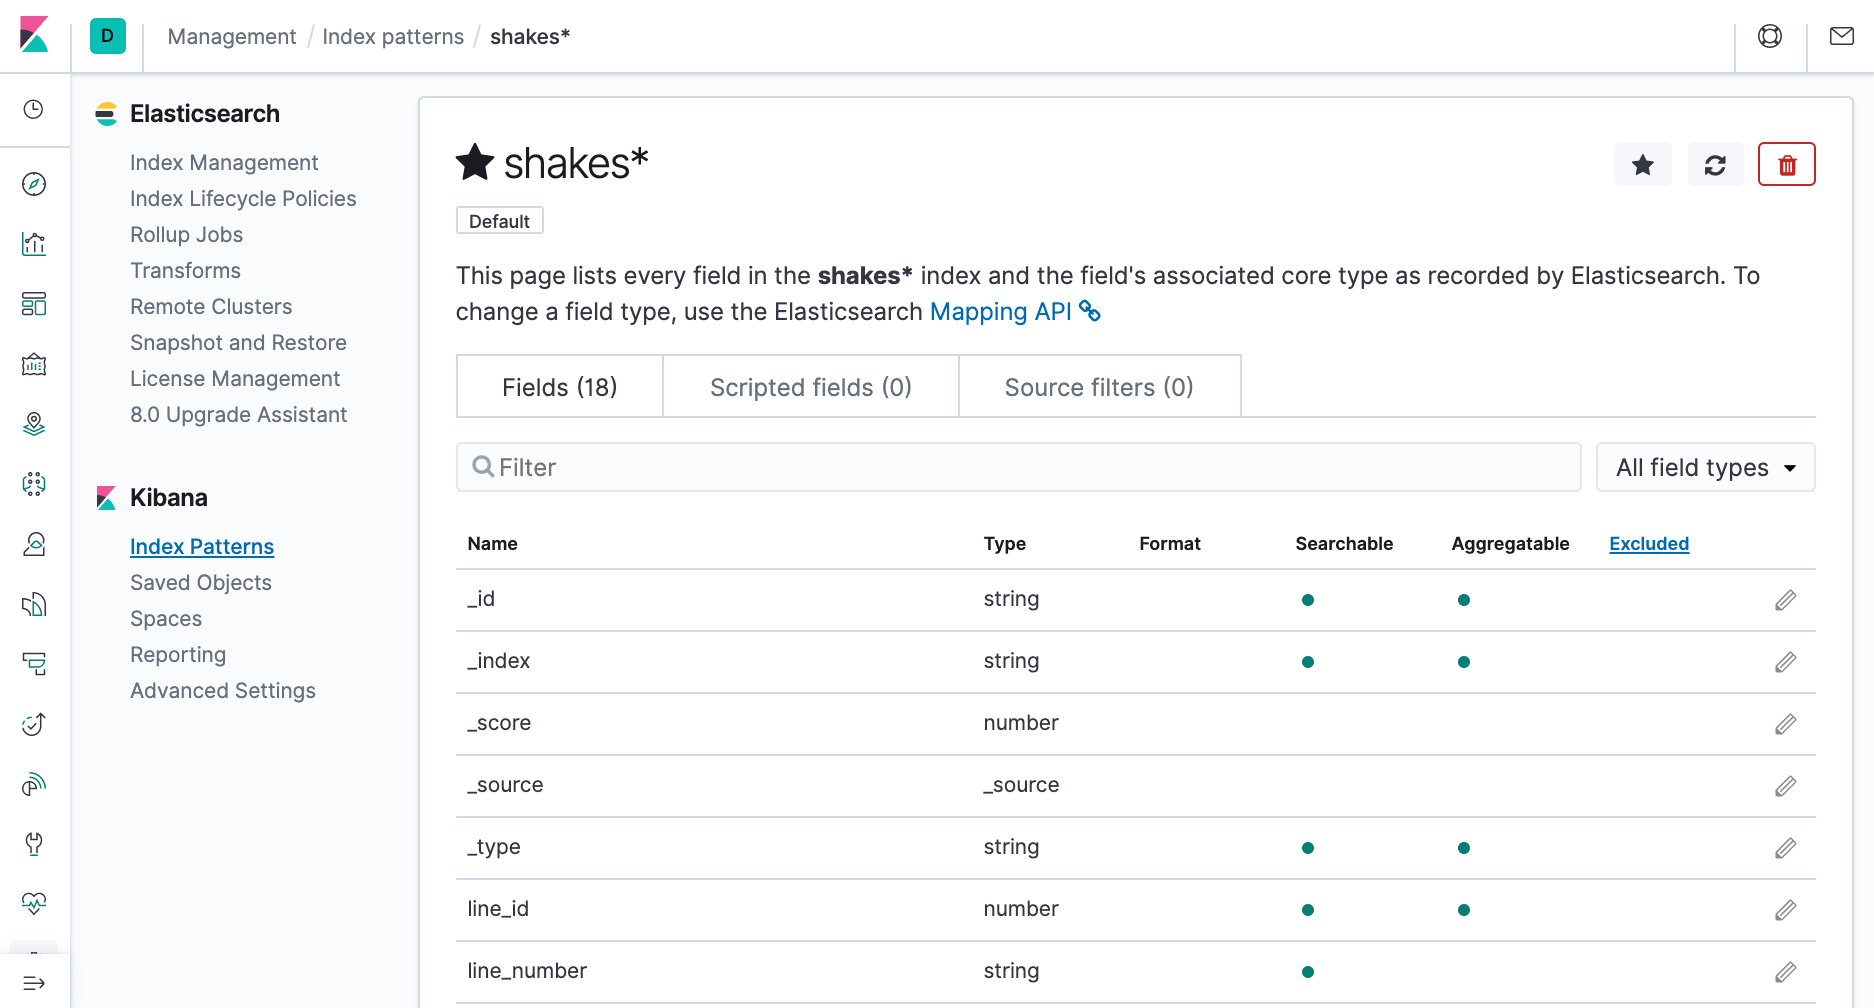
- In Configure settings, click Create index pattern. We're presented a table of all fields and associated data types in the index.
- Return to the Index patterns overview page and define a second index pattern named ba*.
- Return to the Index patterns overview page and define a second index pattern named ba*.
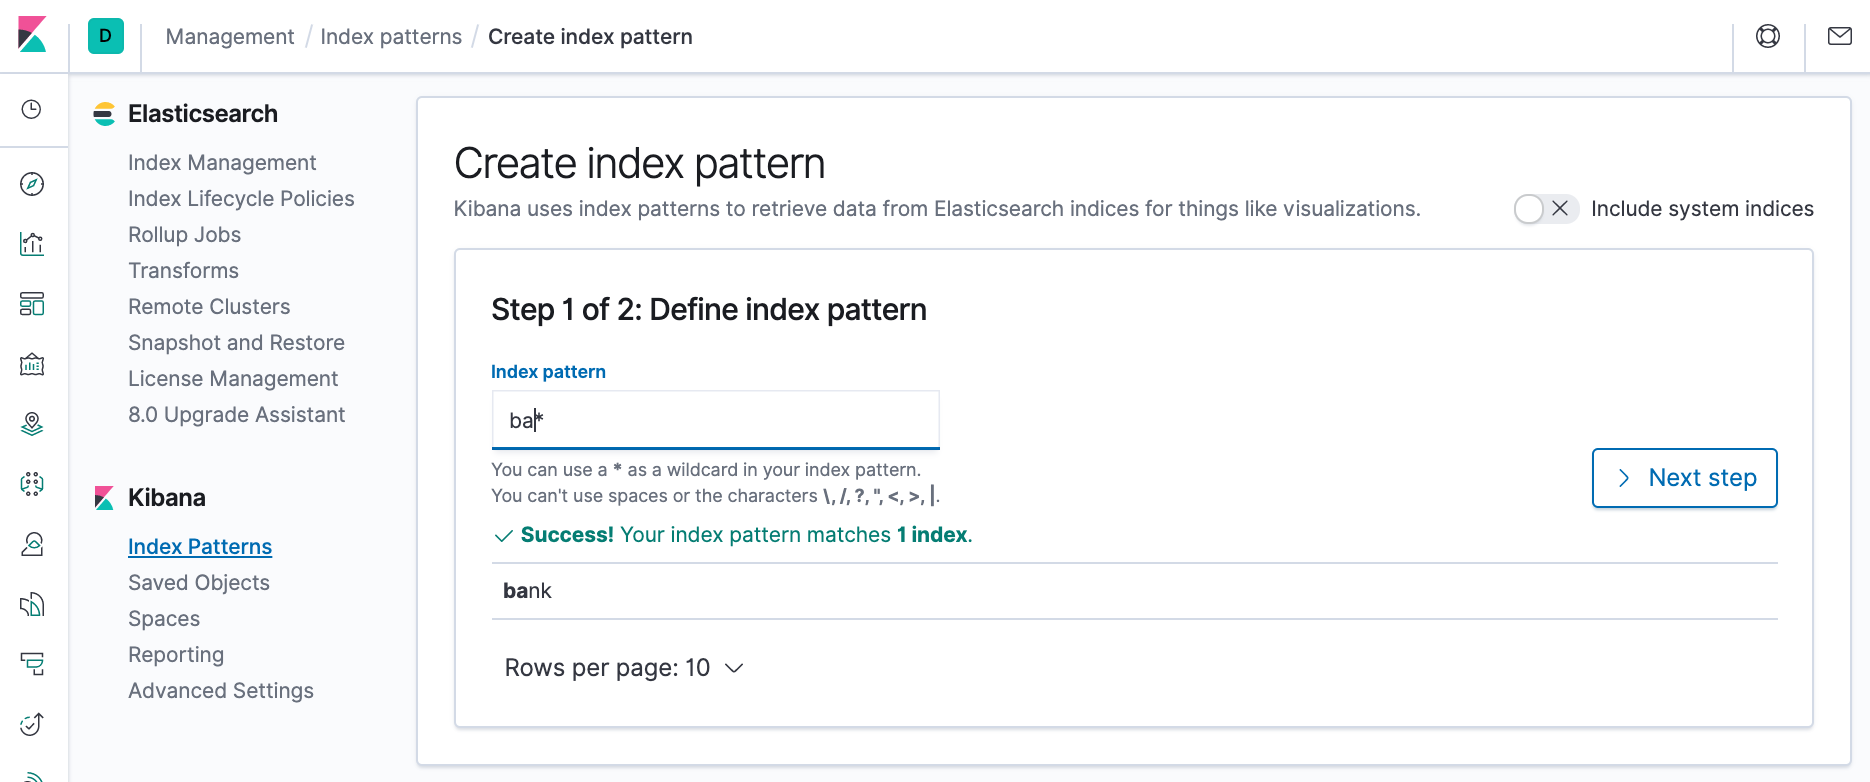
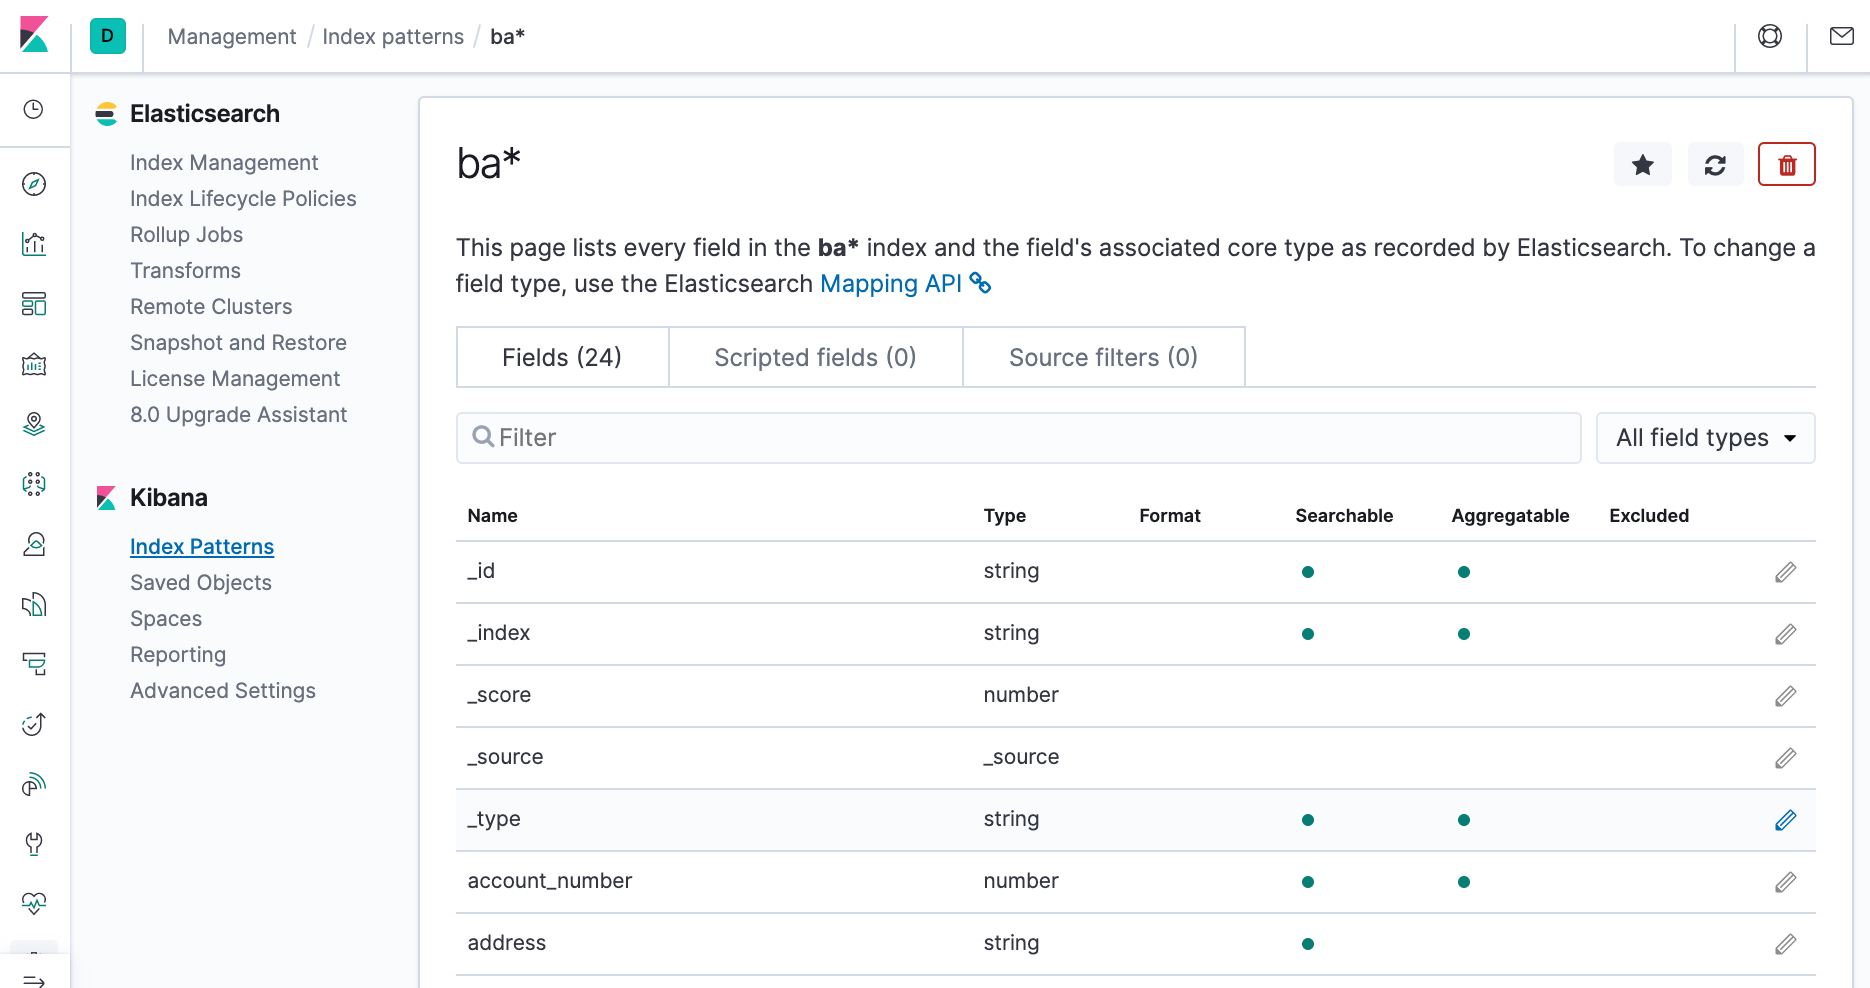
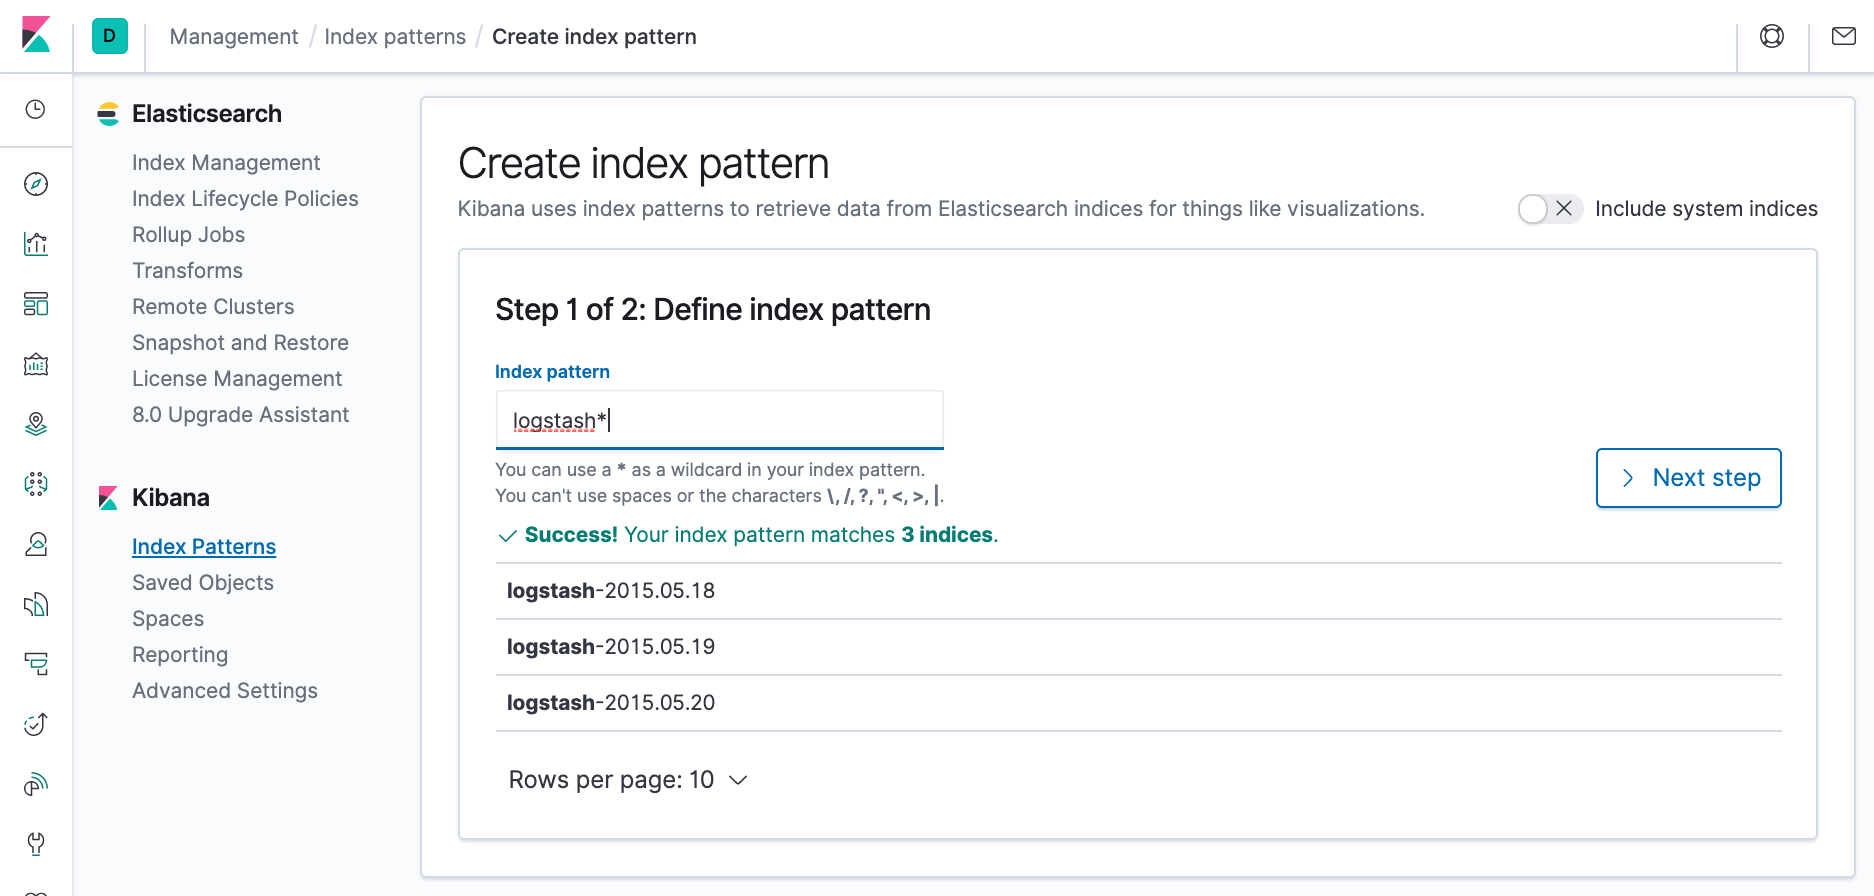
Now create an index pattern for the Logstash index, which contains time series data.
- Define an index pattern named logstash*.
- Click Next step.
- Open the Time Filter field name dropdown and select @timestamp.
- Click Create index pattern.
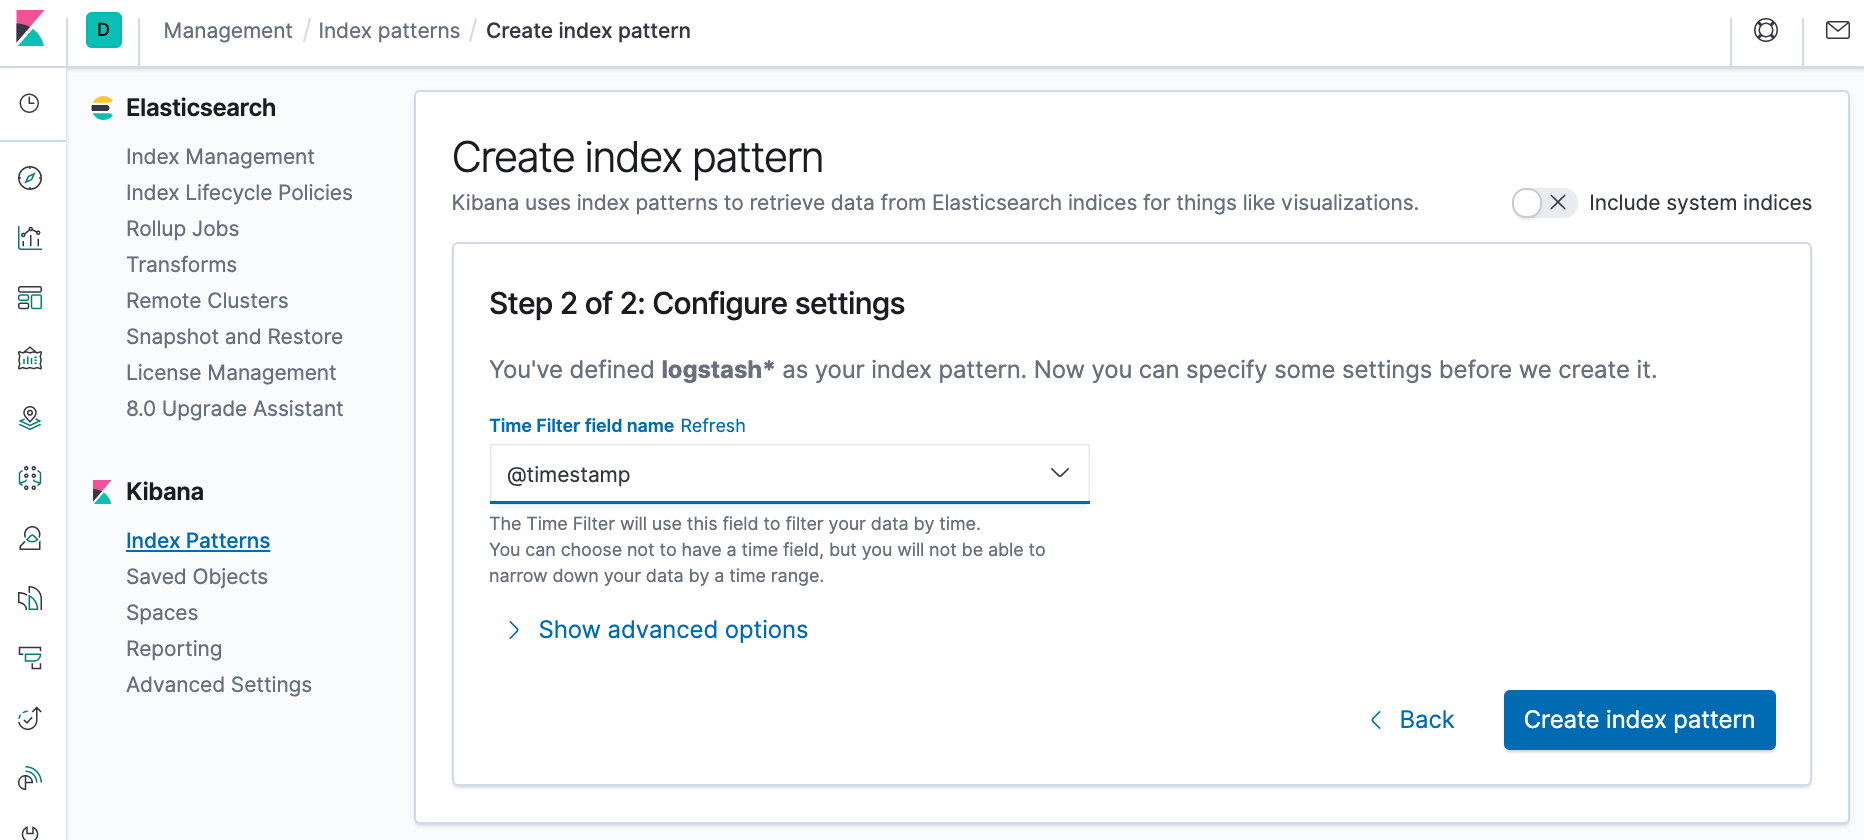
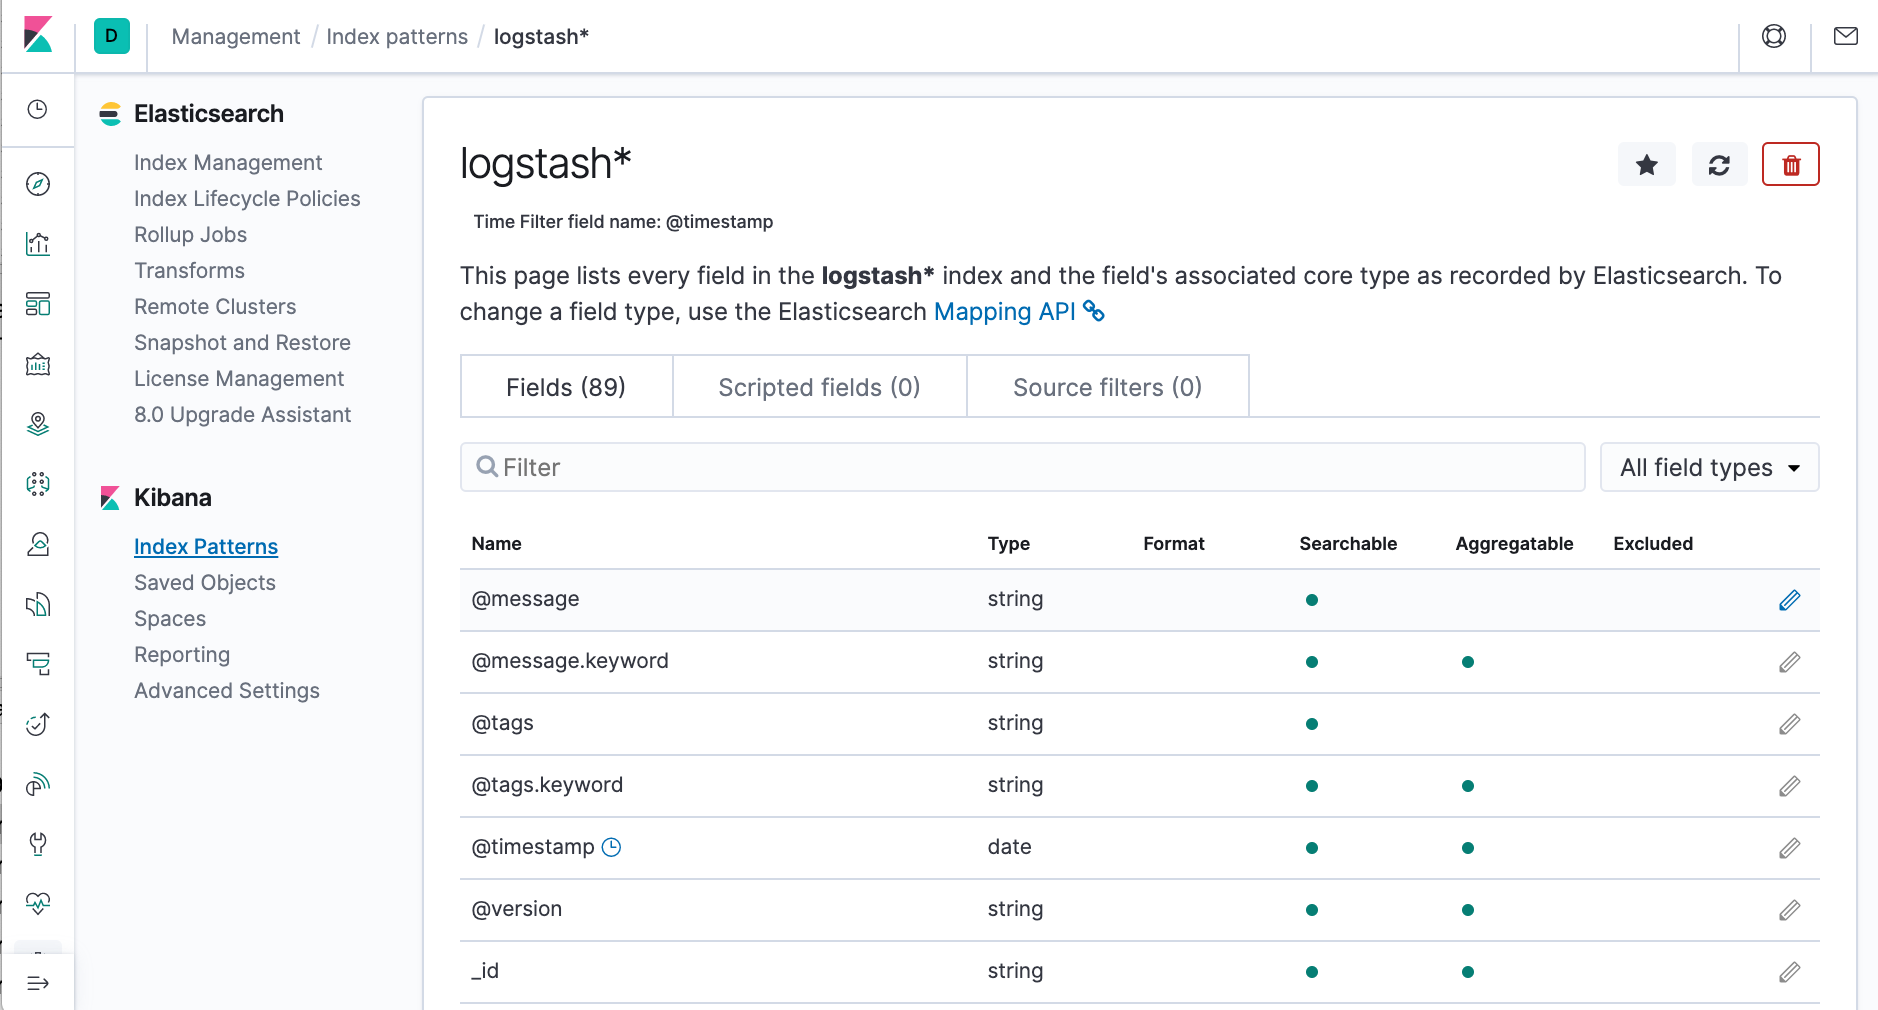
To check which indices are available, we can use curl -XGET "http://localhost:9200/_cat/indices":
$ curl -XGET "http://localhost:9200/_cat/indices"
green  open .monitoring-kibana-7-2020.04.13   WOLVjTHoTFCUIvnTTZu4-A 1 0   5806      0   1.2mb   1.2mb
green  open .monitoring-logstash-7-2020.04.13 b43BCik-SiGdvqT9PG9LzA 1 0  28946      0   2.8mb   2.8mb
green  open .monitoring-es-7-2020.04.13       Hoe8zupVROWPoH9iu_ohPQ 1 0 102368 100335  51.3mb  51.3mb
green  open .apm-agent-configuration          JUka-5_KTEy2Bl9RL6G2Jg 1 0      0      0    283b    283b
yellow open logstash-2015.05.20               wamWuTcbQPKbM8GtXX0k9g 1 1   4750      0  16.3mb  16.3mb
green  open .kibana_1                         Ap4W0LRrTE6zFoiZoU1thg 1 0     10      1  58.2kb  58.2kb
yellow open bank                              yAPhAGD1SU-RKkE-9K5N-g 1 1   1000      0 414.1kb 414.1kb
green  open .kibana_task_manager_1            2u_N047ZQkacx-zHLFPIZw 1 0      2      1  51.5kb  51.5kb
green  open ilm-history-1-000001              NYk4iKbVQTu_scOIe-ezig 1 0    291      0 265.7kb 265.7kb
yellow open logstash-2020.04.13-000001        OLtmxHmtTyybWJohPbWXJA 1 1      0      0    283b    283b
yellow open shakespeare                       5Z9B0M15Qv2LRLmBHrEDMw 1 1 111396      0  21.5mb  21.5mb
yellow open logstash-2015.05.18               I8Dsy-_yRrK81V4DyDqO5w 1 1   4631      0  16.3mb  16.3mb
yellow open logstash-2015.05.19               1n_-xYVYTx-zIM8y3Pwqxg 1 1   4624      0  16.4mb  16.4mb
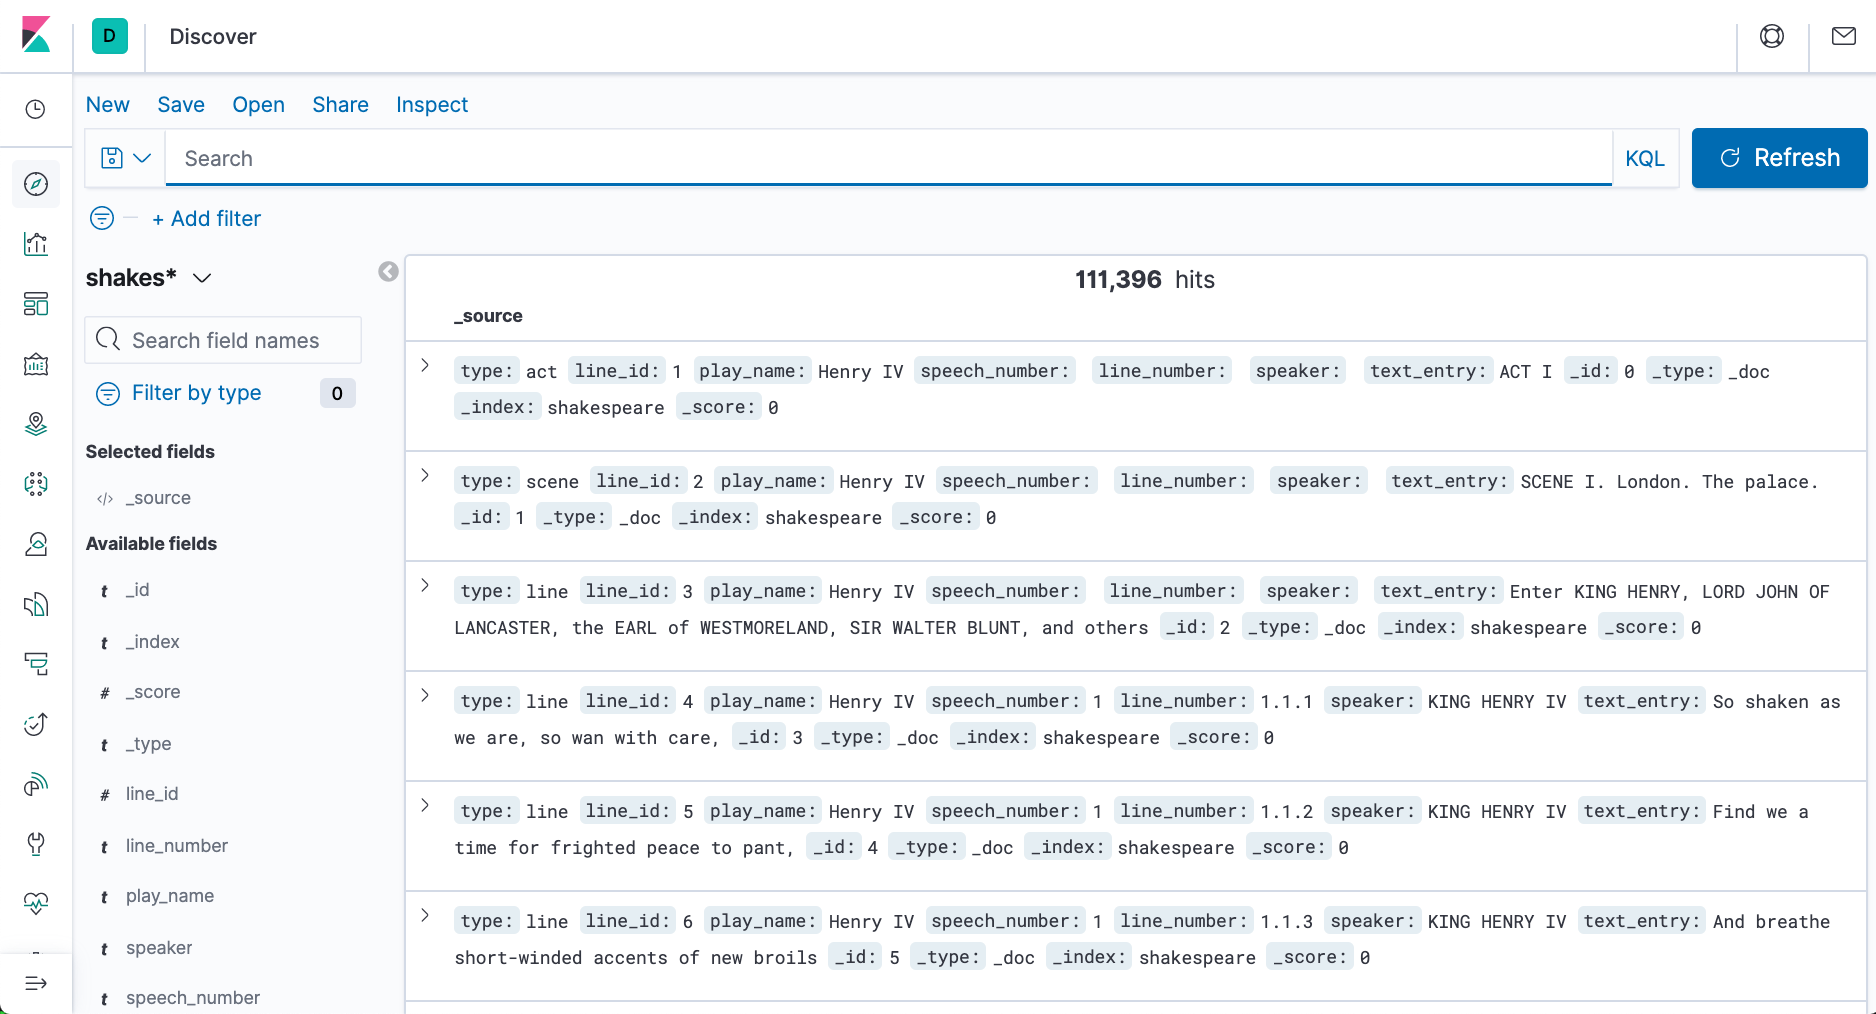
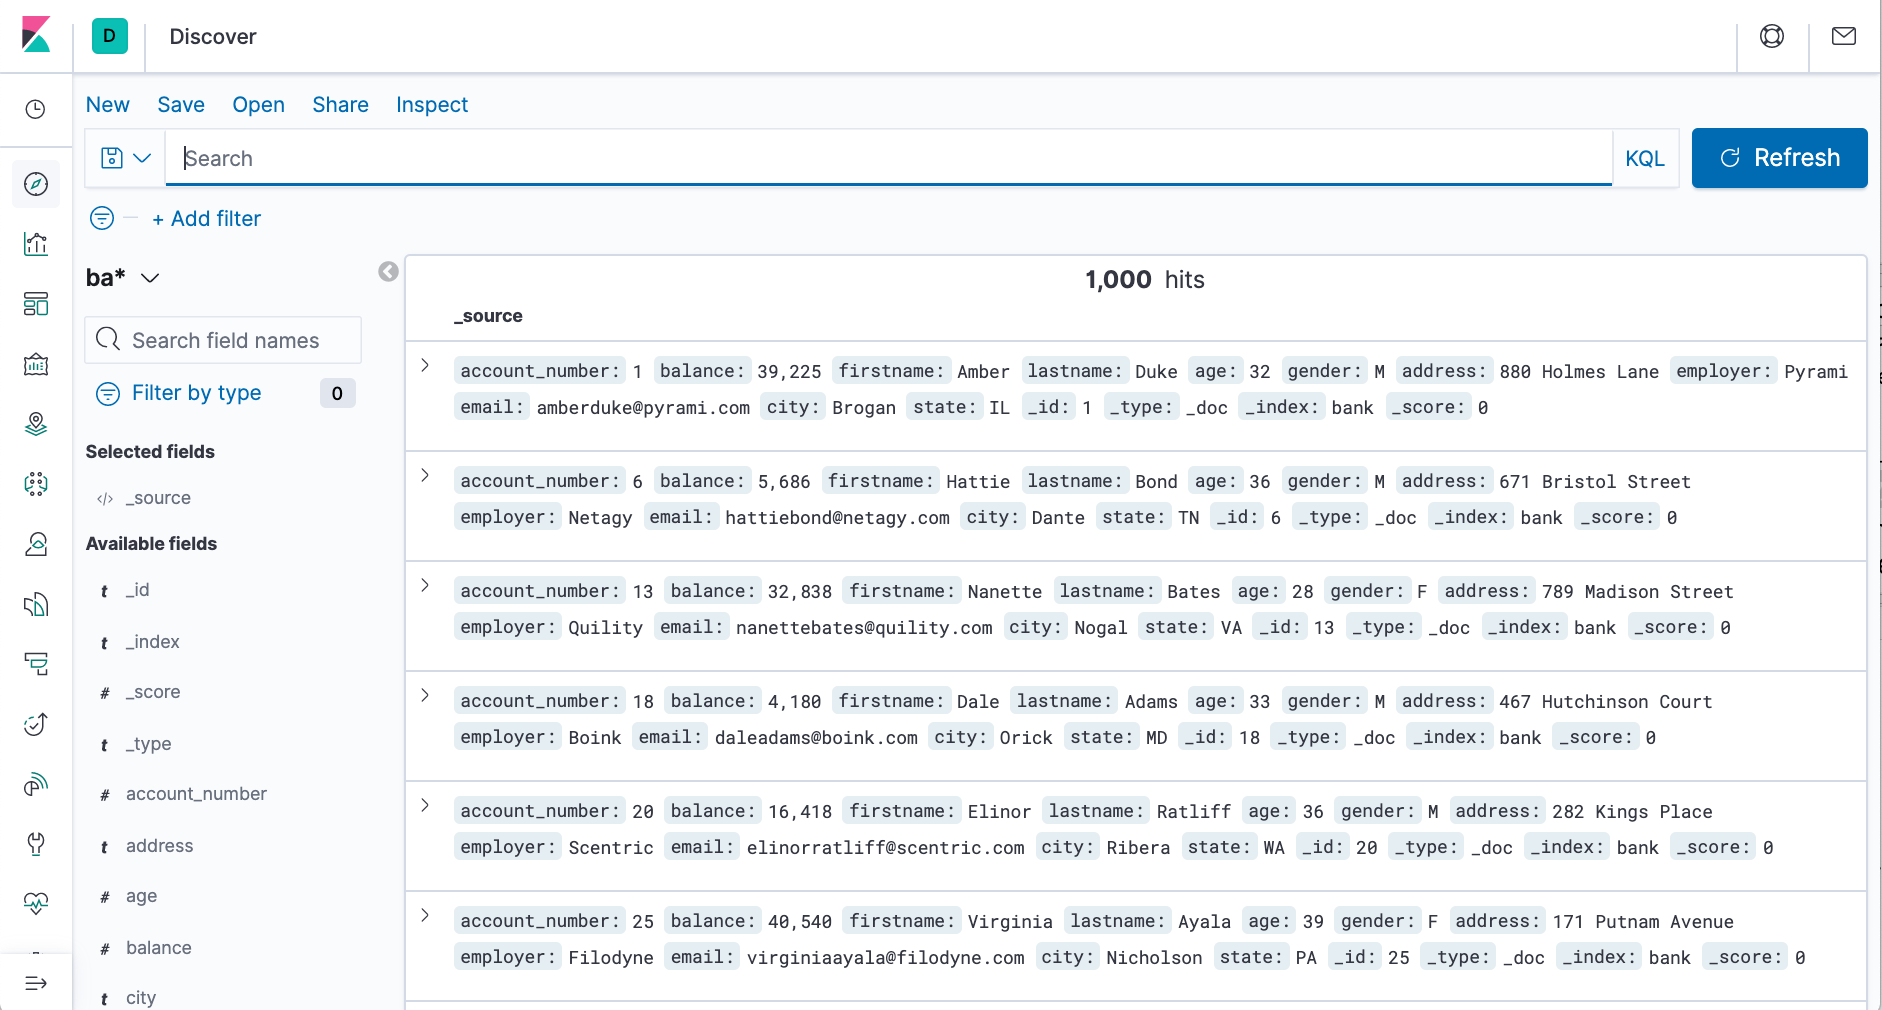
Using Discover, enter an Elasticsearch query to search our data and filter the results.
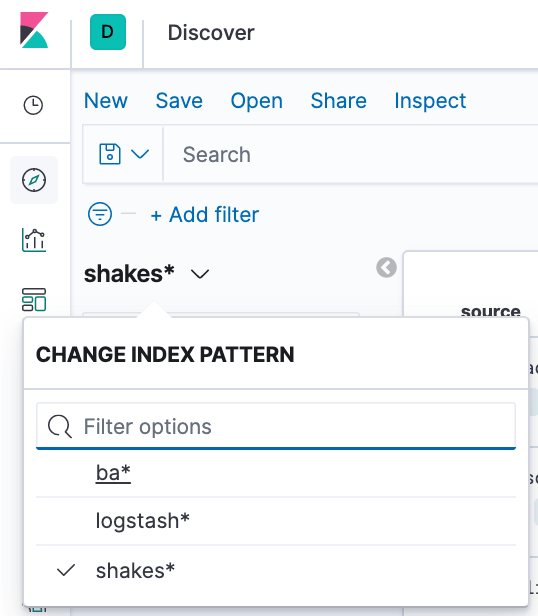
- Open Discover. The shakes* index pattern appears.
- To make ba* the current index, click the index pattern dropdown, then select ba*.
By default, all fields are shown for each matching document. - In the search field, enter:
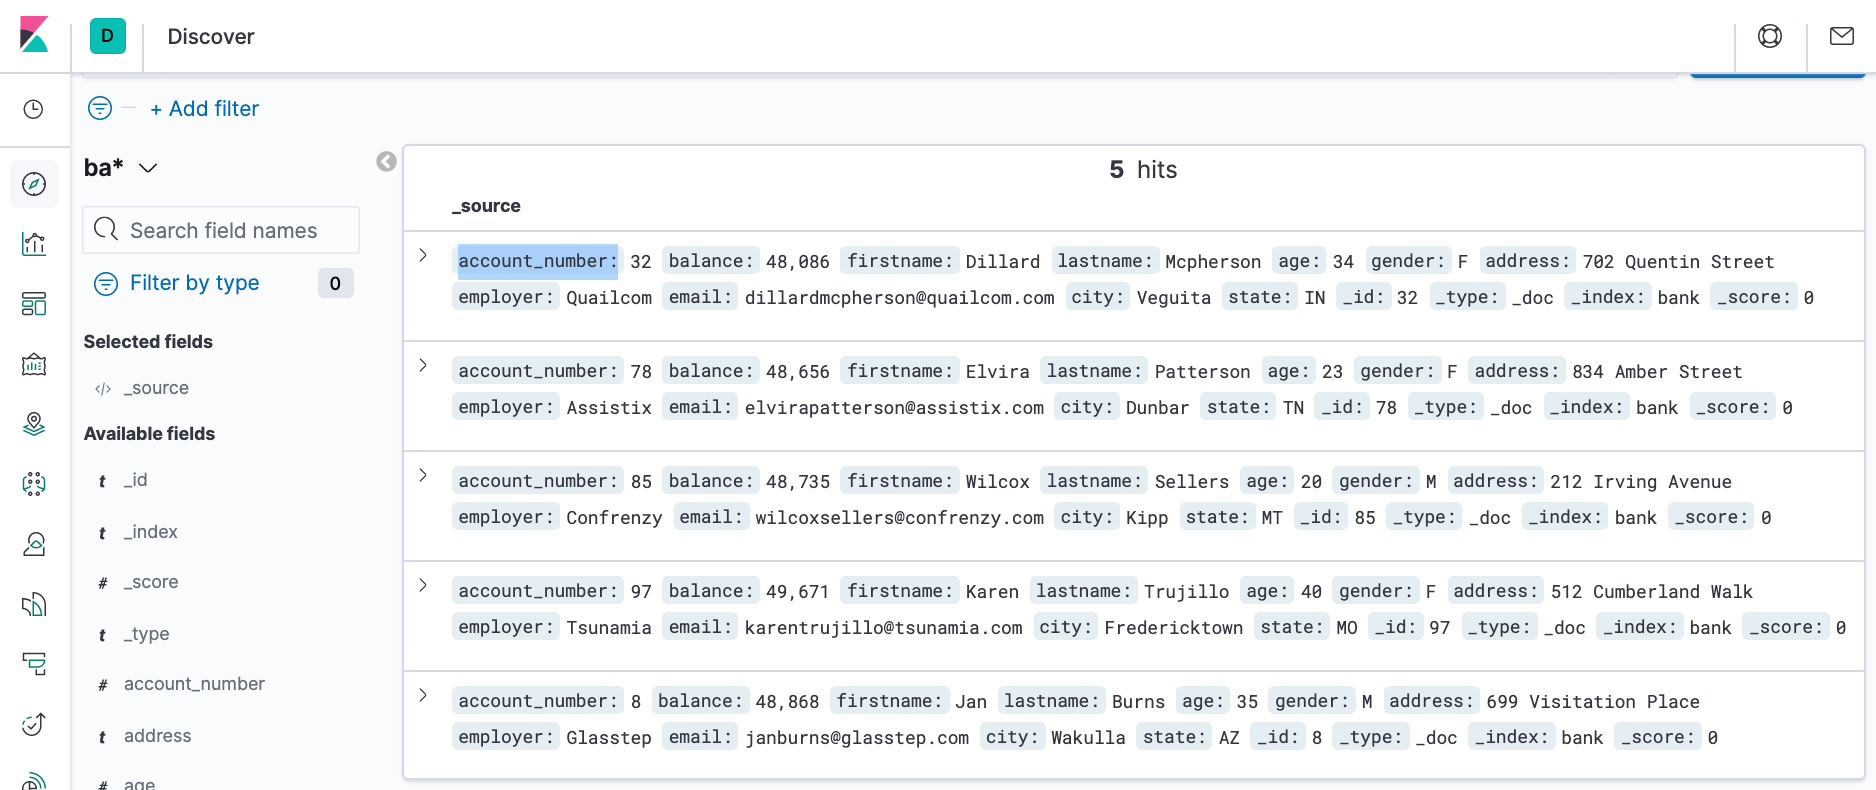
- Hover over the list of Available fields, then click add next to each field we want include as a column in the table. For example, when we add the account_number field,
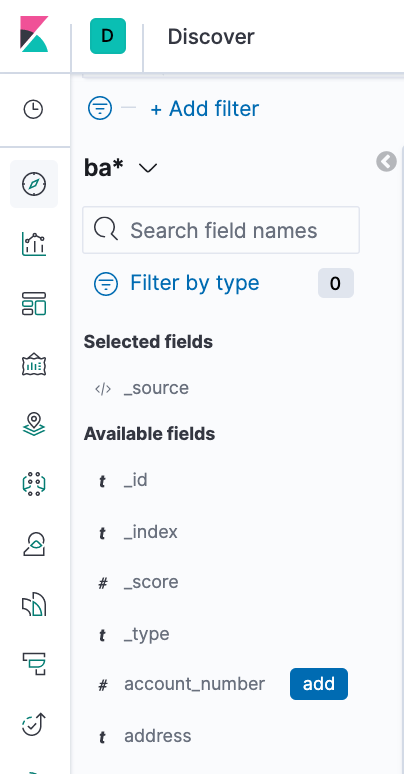
the display changes to a list of five account numbers.
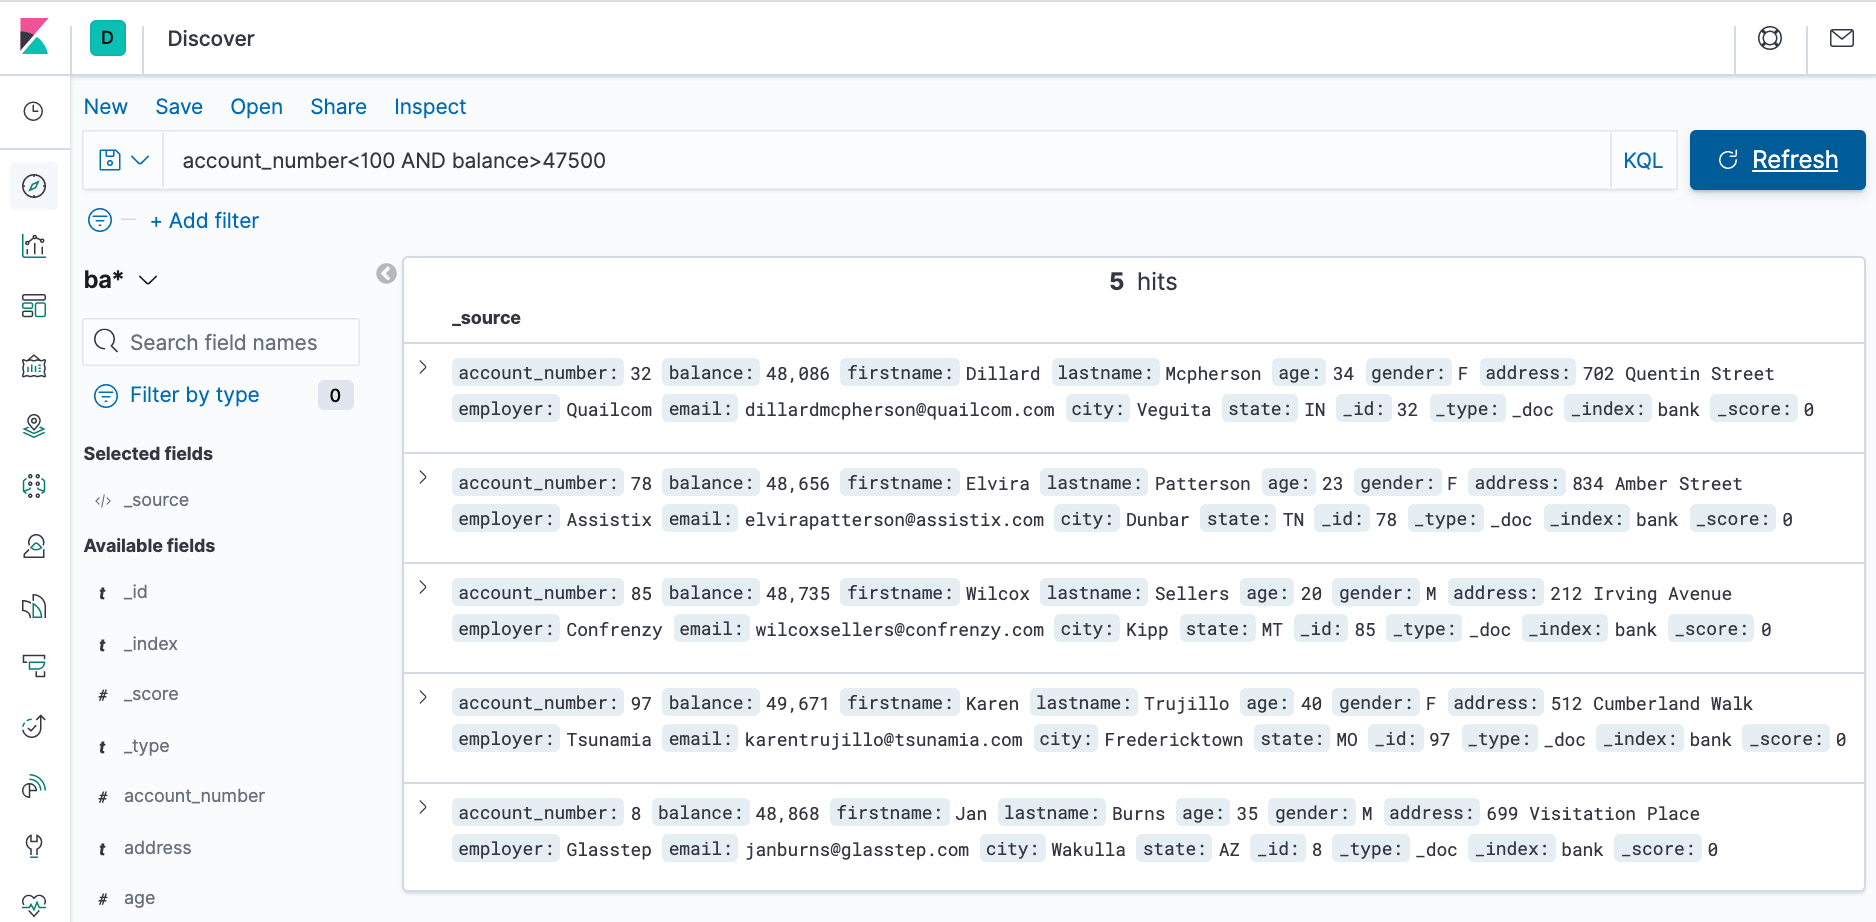
account_number<100 AND balance>47500
The search returns all account numbers between zero and 99 with balances in excess of 47,500. Results appear for account numbers 8, 32, 78, 85, and 97.
In the Visualize application, we can shape our data using a variety of charts, tables, and maps, and more. In this tutorial, we'll create four visualizations:
- Pie chart
- Bar chart
- Map
- Markdown widget
We'll use the pie chart to gain insight into the account balances in the bank account data.
- Open Visualize to show the overview page.
- Click Create new visualization. We'll see all the visualization types in Kibana.
- Click Pie.
- In Choose a source, select the ba* index pattern.
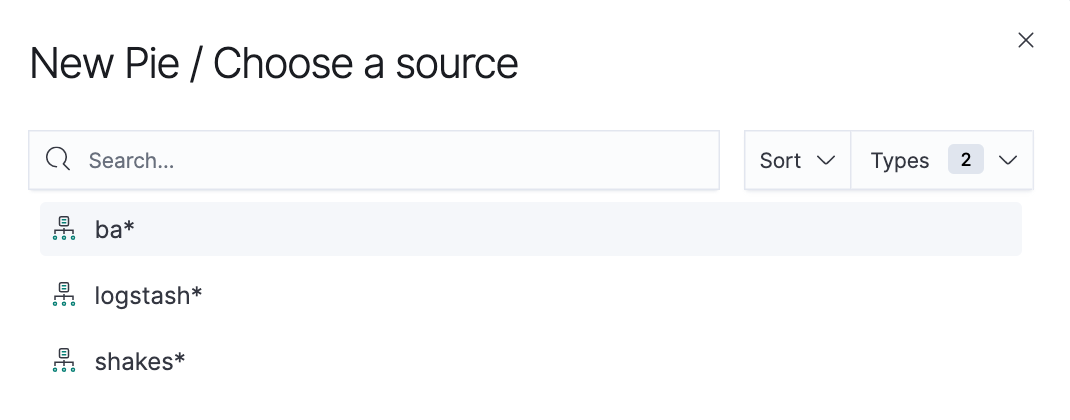
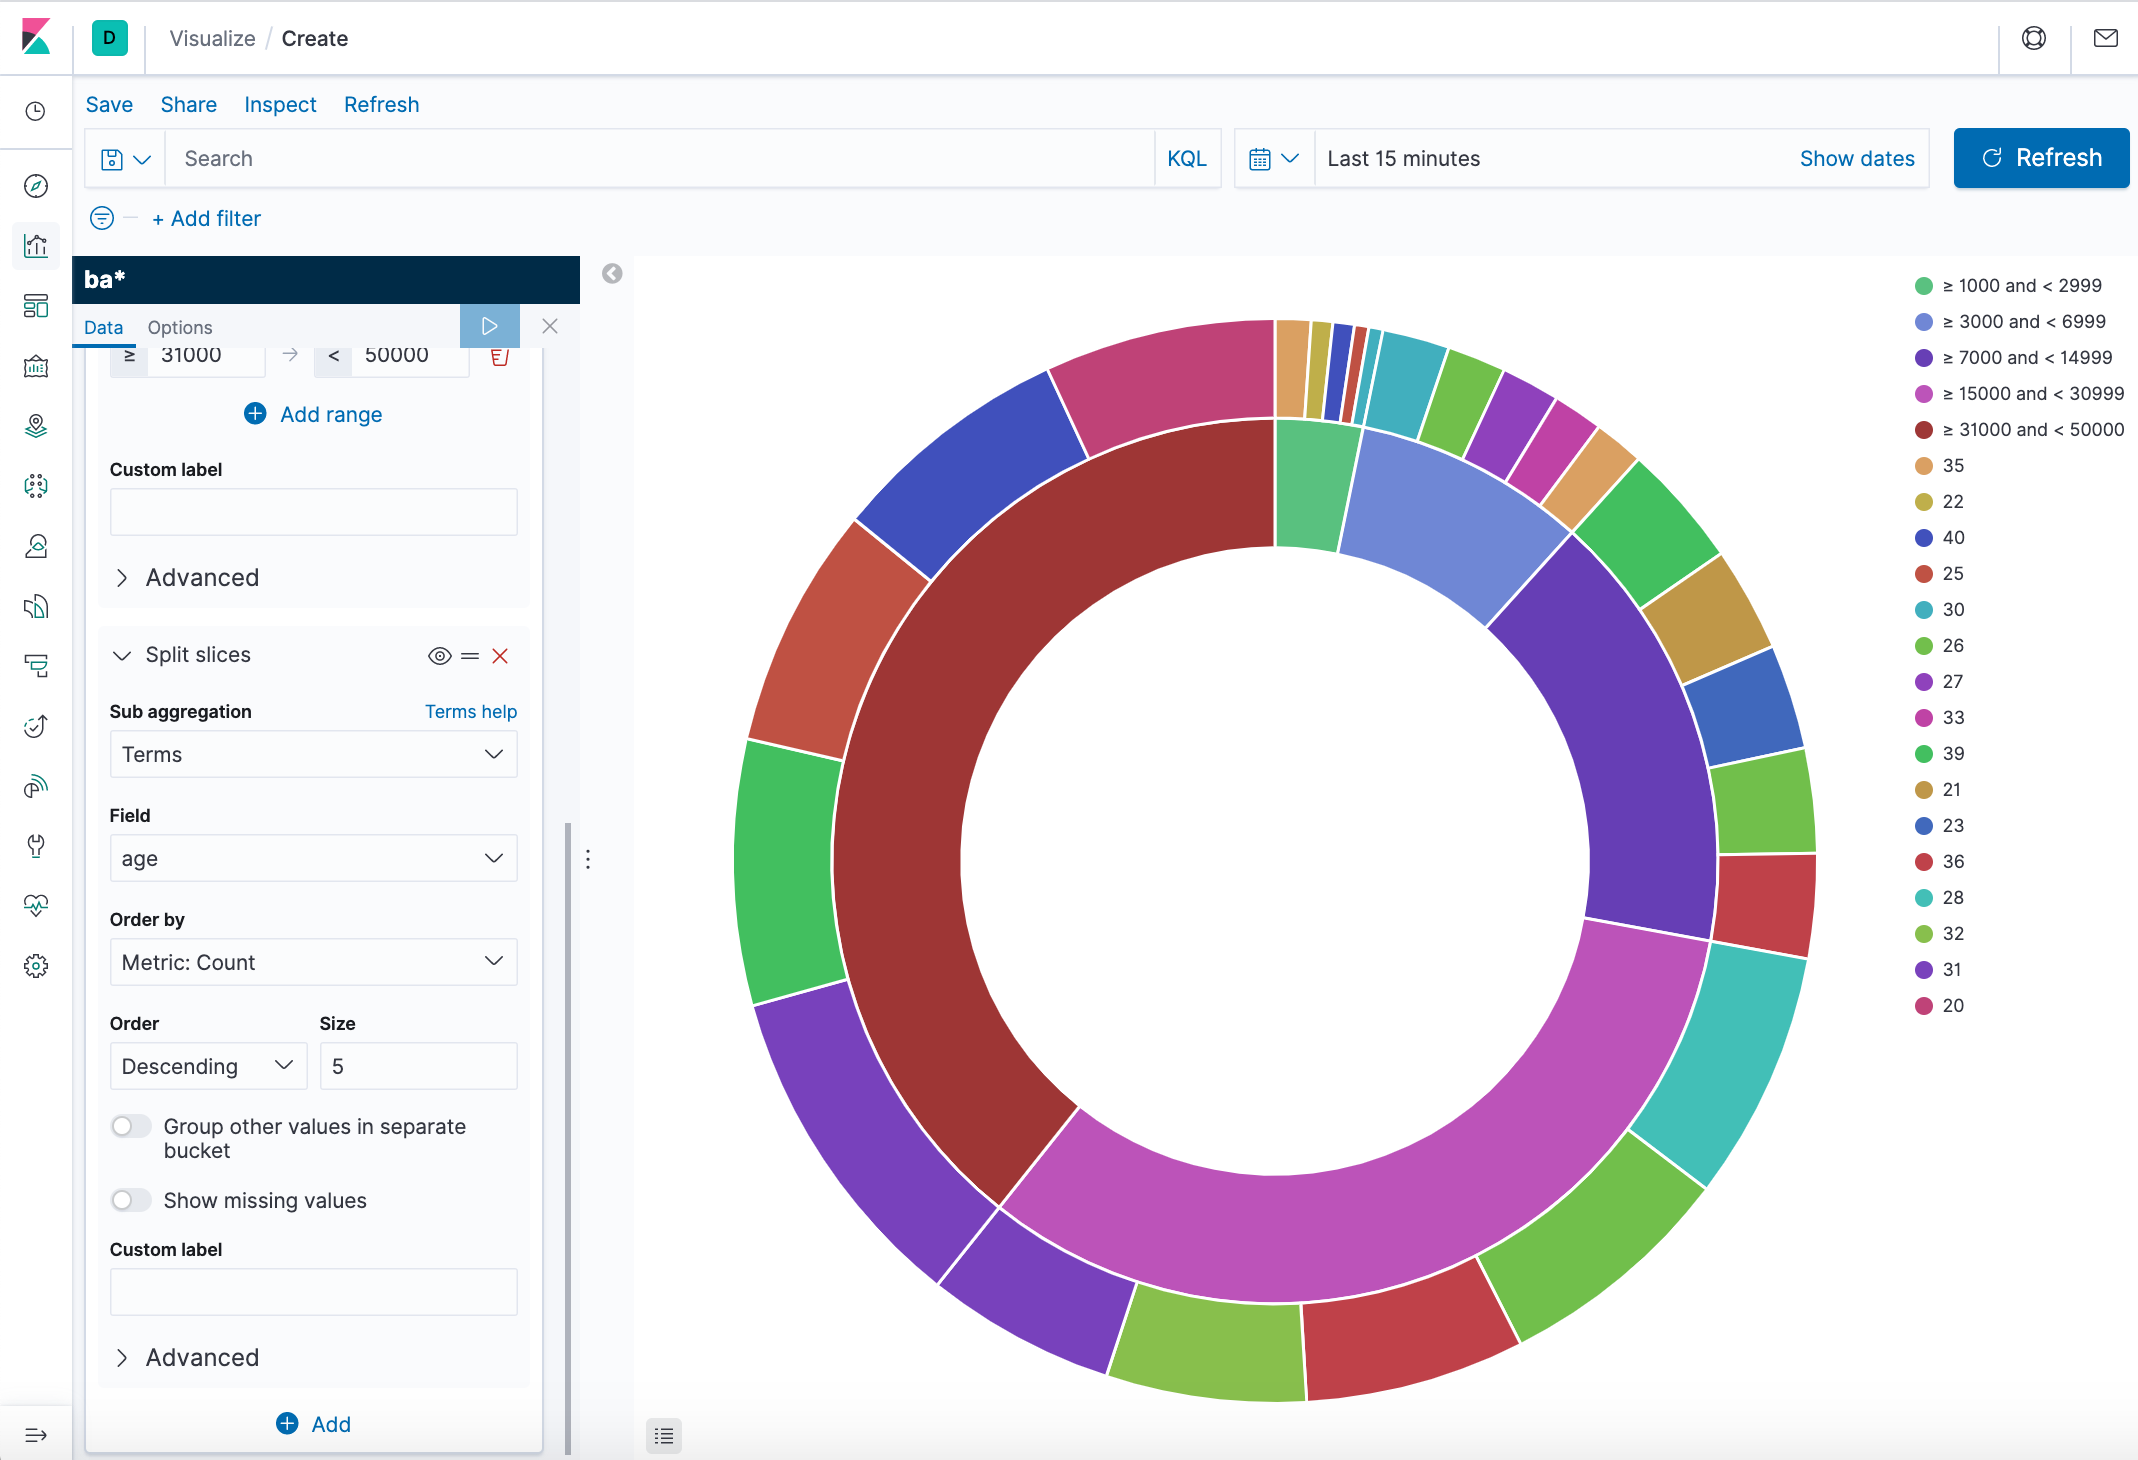
Initially, the pie contains a single "slice." That's because the default search matched all documents. To specify which slices to display in the pie, we use an Elasticsearch bucket aggregation. This aggregation sorts the documents that match our search criteria into different categories. We'll use a bucket aggregation to establish multiple ranges of account balances and find out how many accounts fall into each range. -
In the Buckets pane, click Add > Split slices.
- In the Aggregation dropdown, select Range.
- In the Field dropdown, select balance.
- Click Add range four times to bring the total number of ranges to six.
- Define the following ranges:
0             999
1000         2999
3000         6999
7000        14999
15000       30999
31000       50000
- Click Apply changes
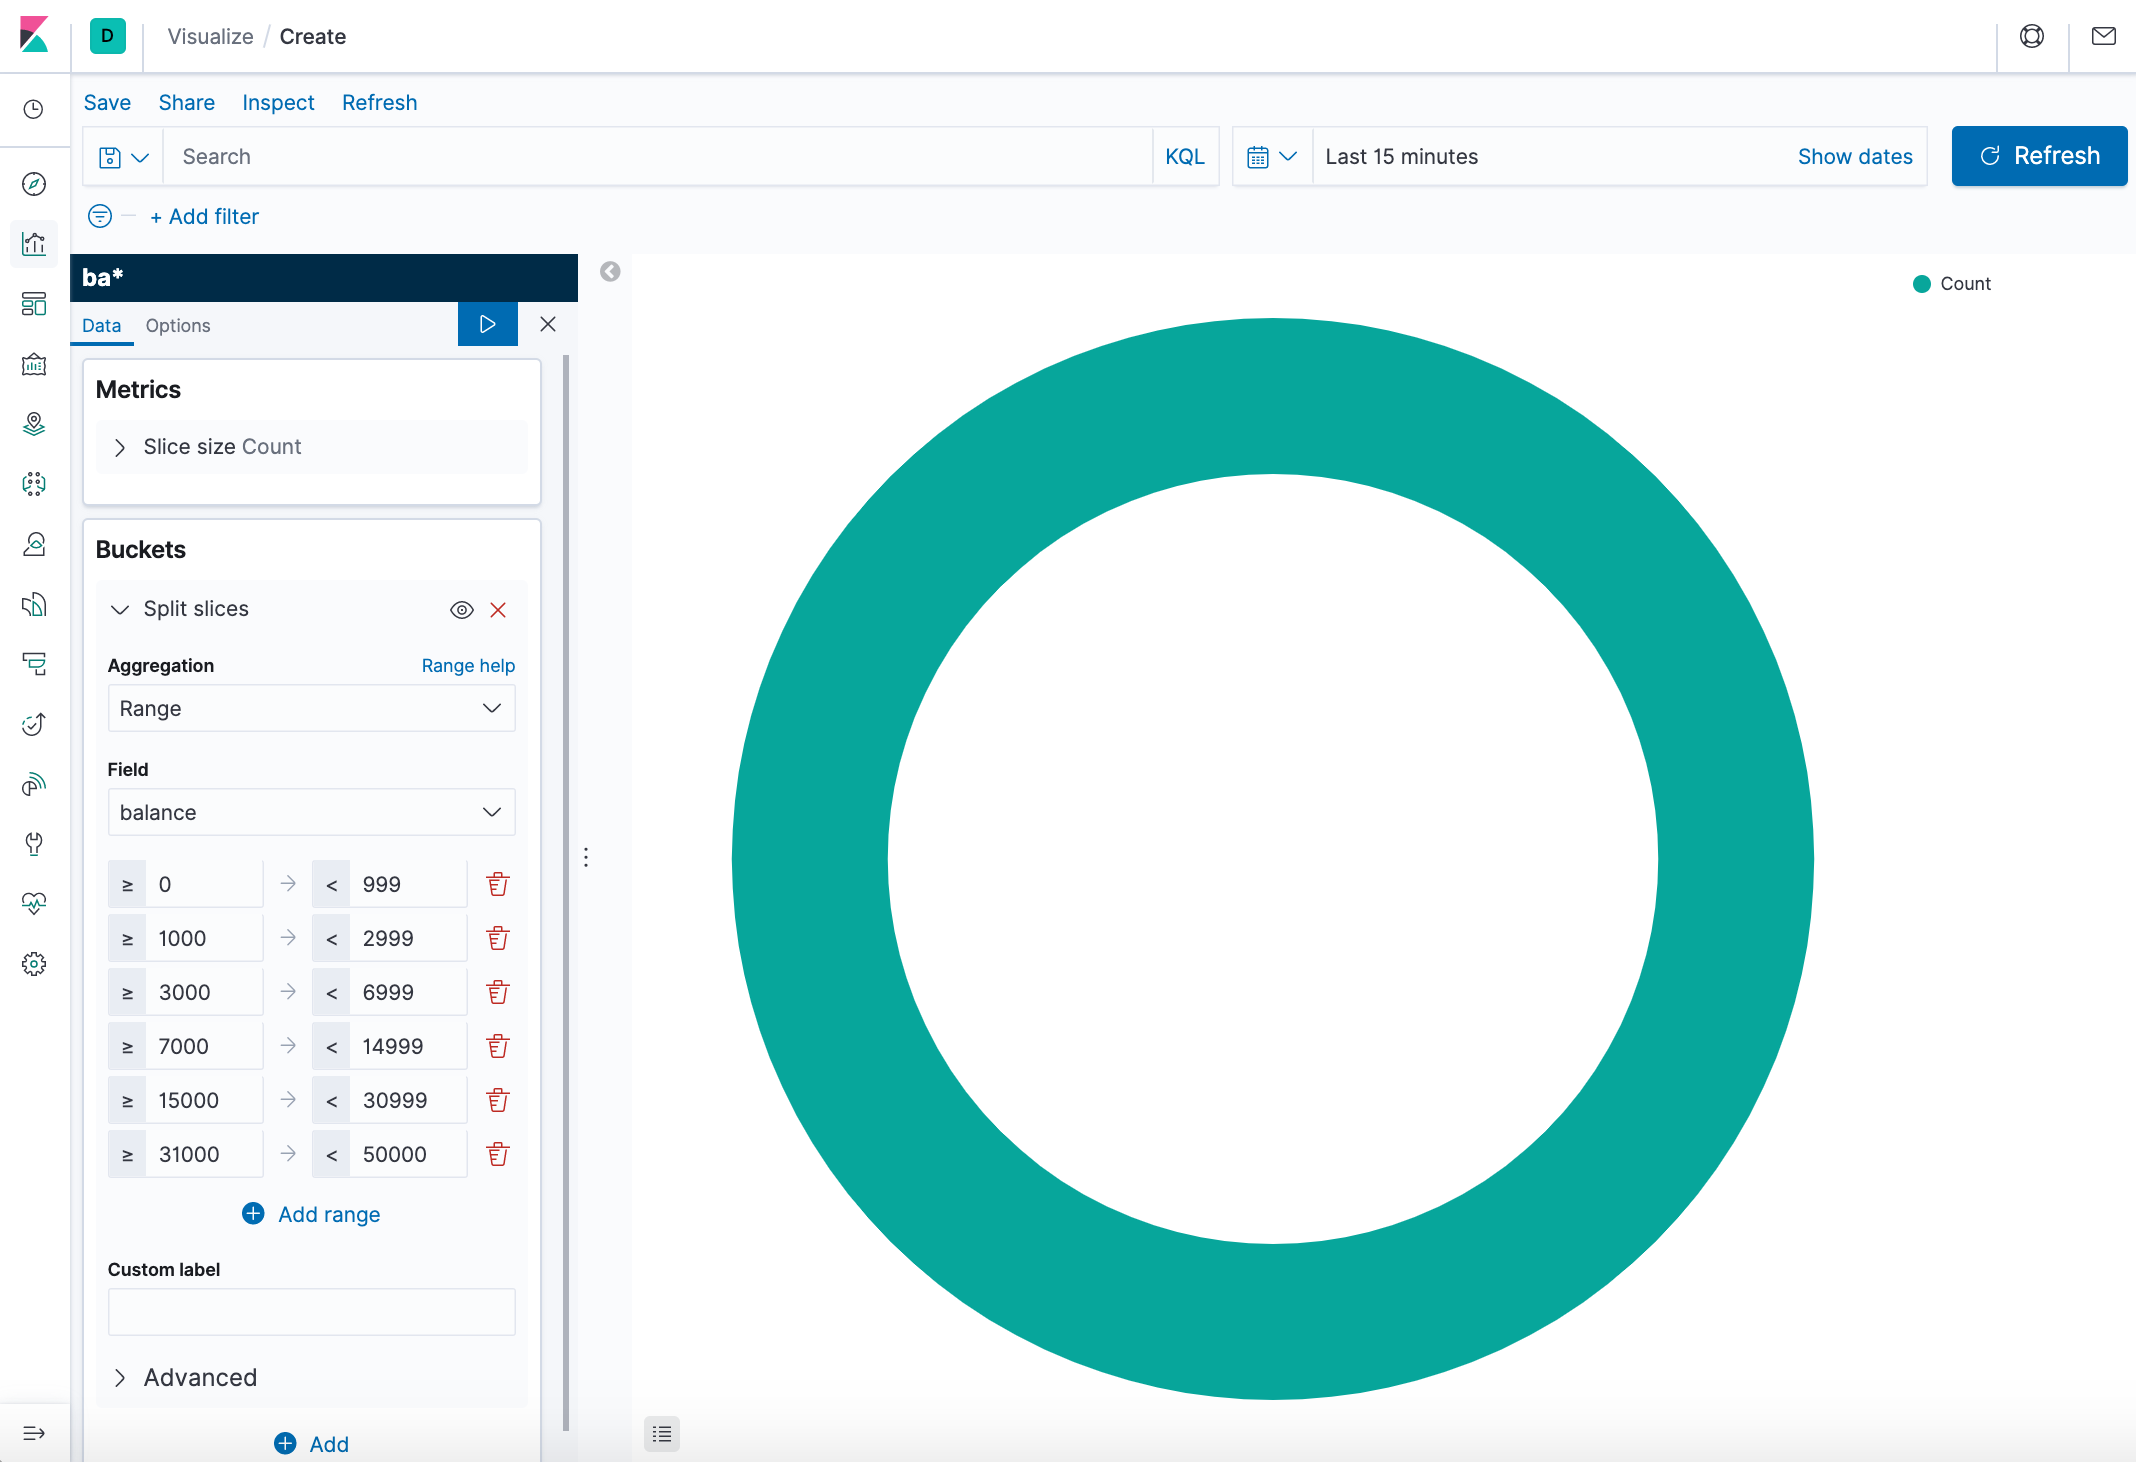
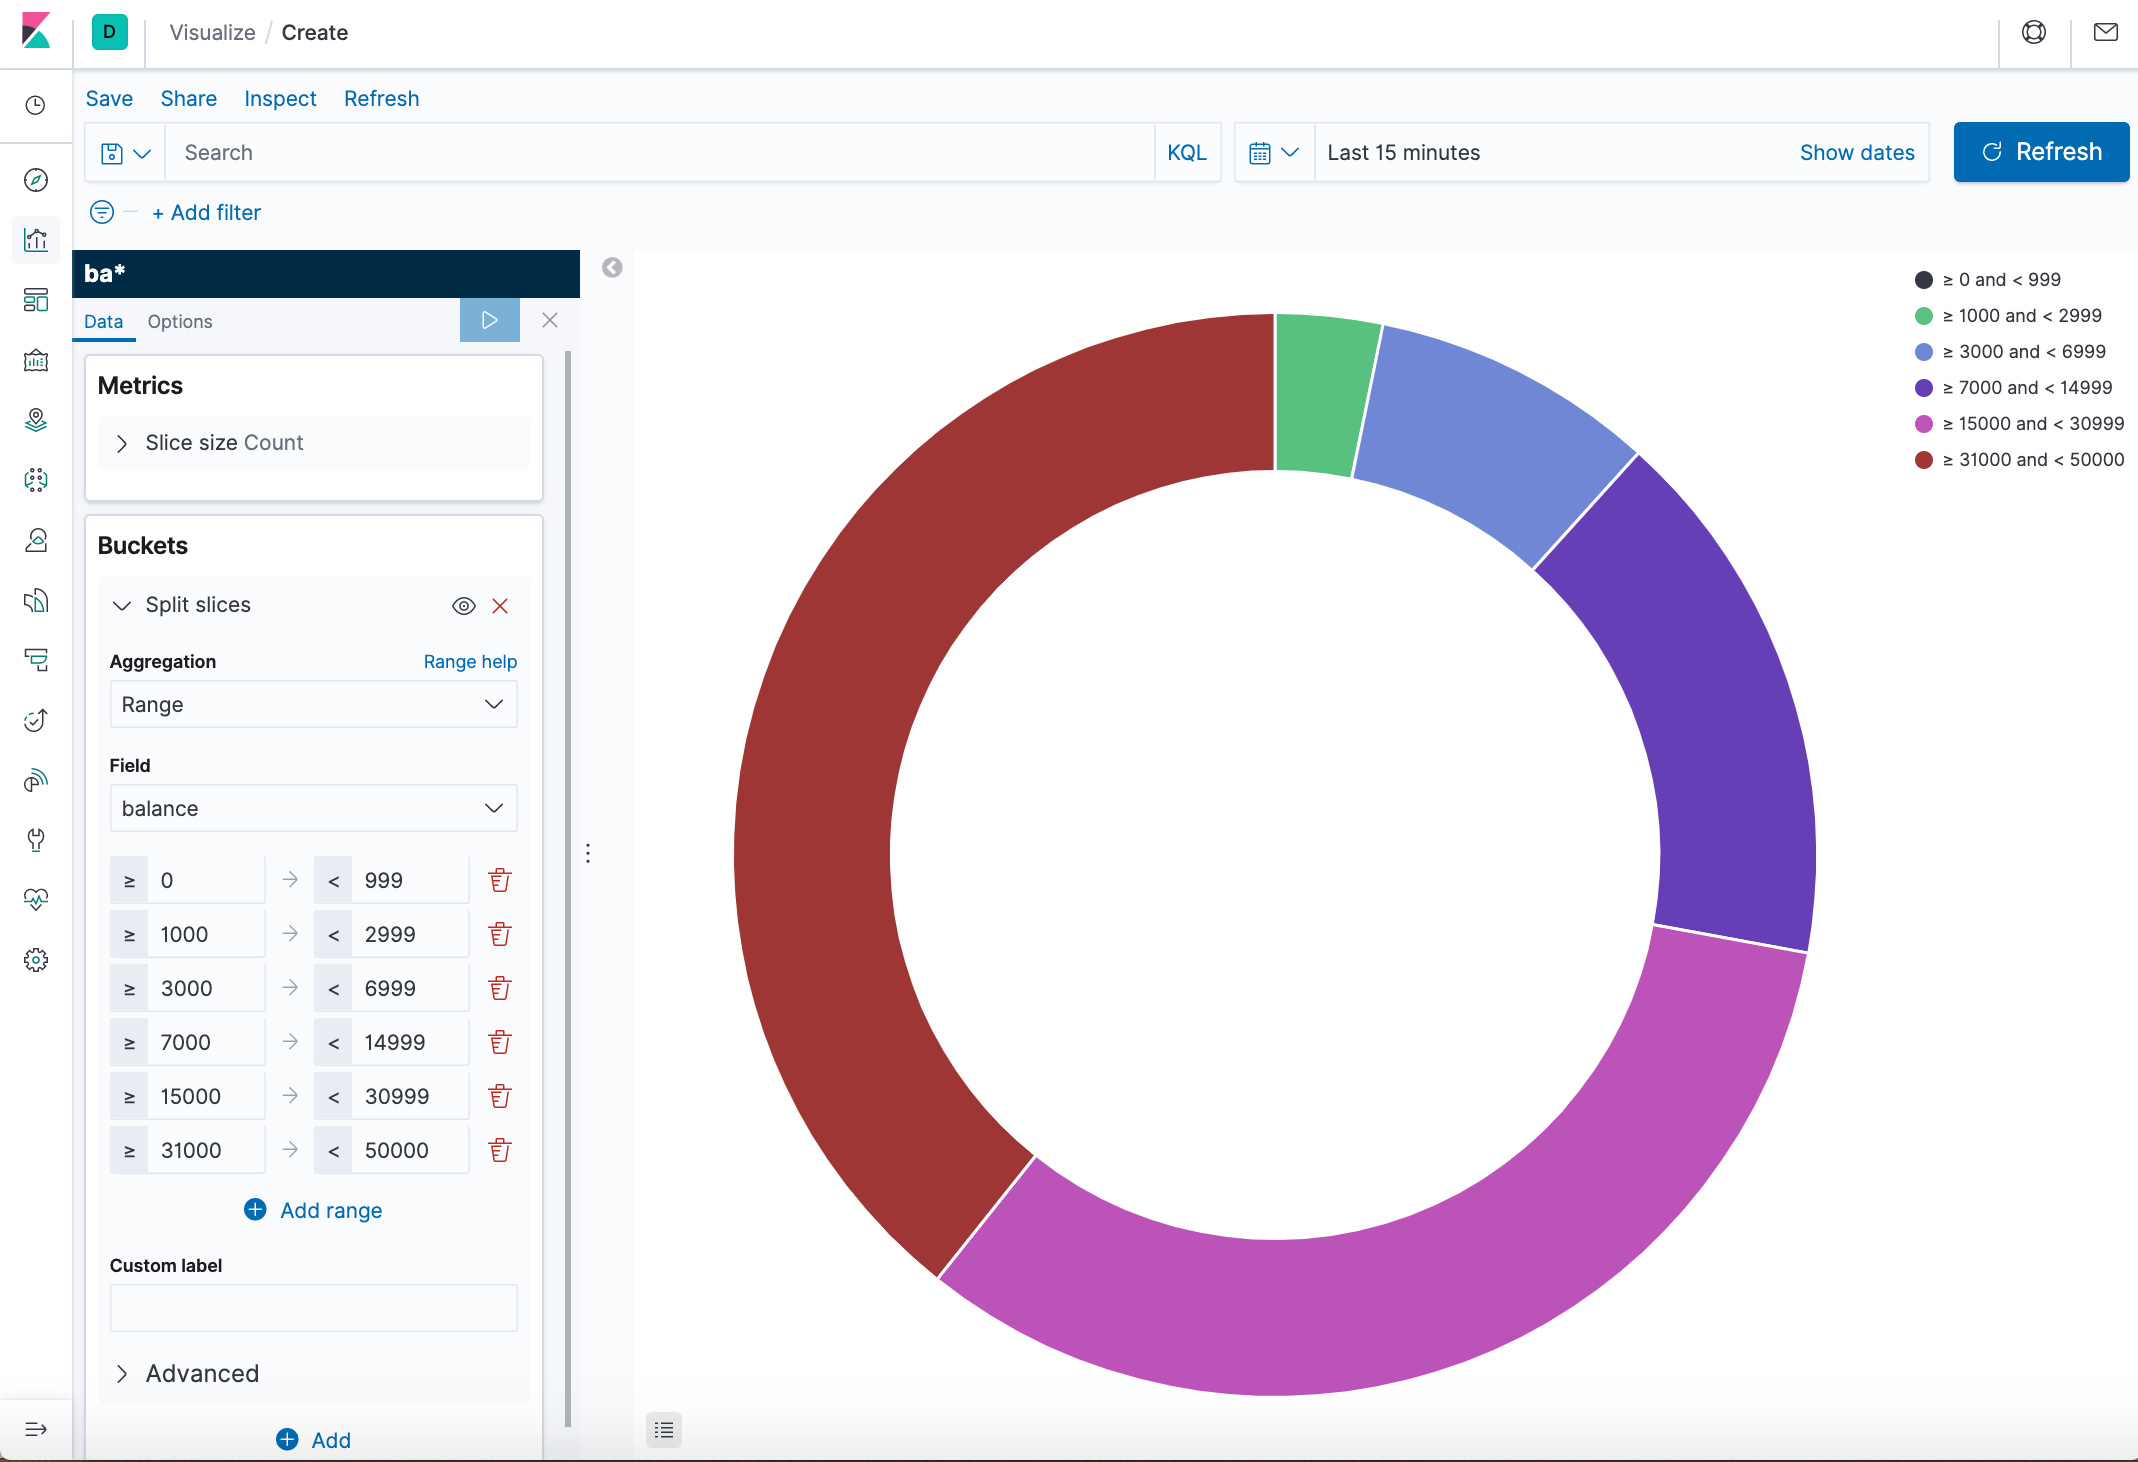
- Add another bucket aggregation that looks at the ages of the account holders.
- At the bottom of the Buckets pane, click Add.
- For sub-bucket type, select Split slices.
- In the Sub aggregation dropdown, select Terms.
- In the Field dropdown, select age.
- Click Apply changes.
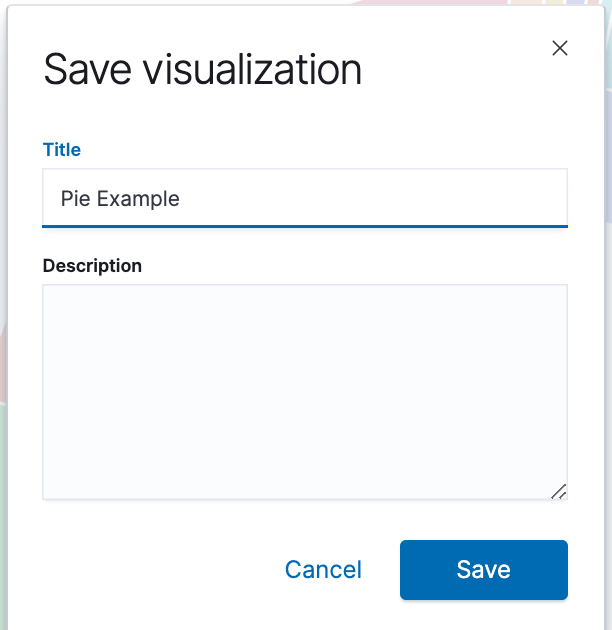
Now we can see the break down of the ages of the account holders, displayed in a ring around the balance ranges. - To save this chart so we can use it later, click Save in the top menu bar and enter Pie Example.
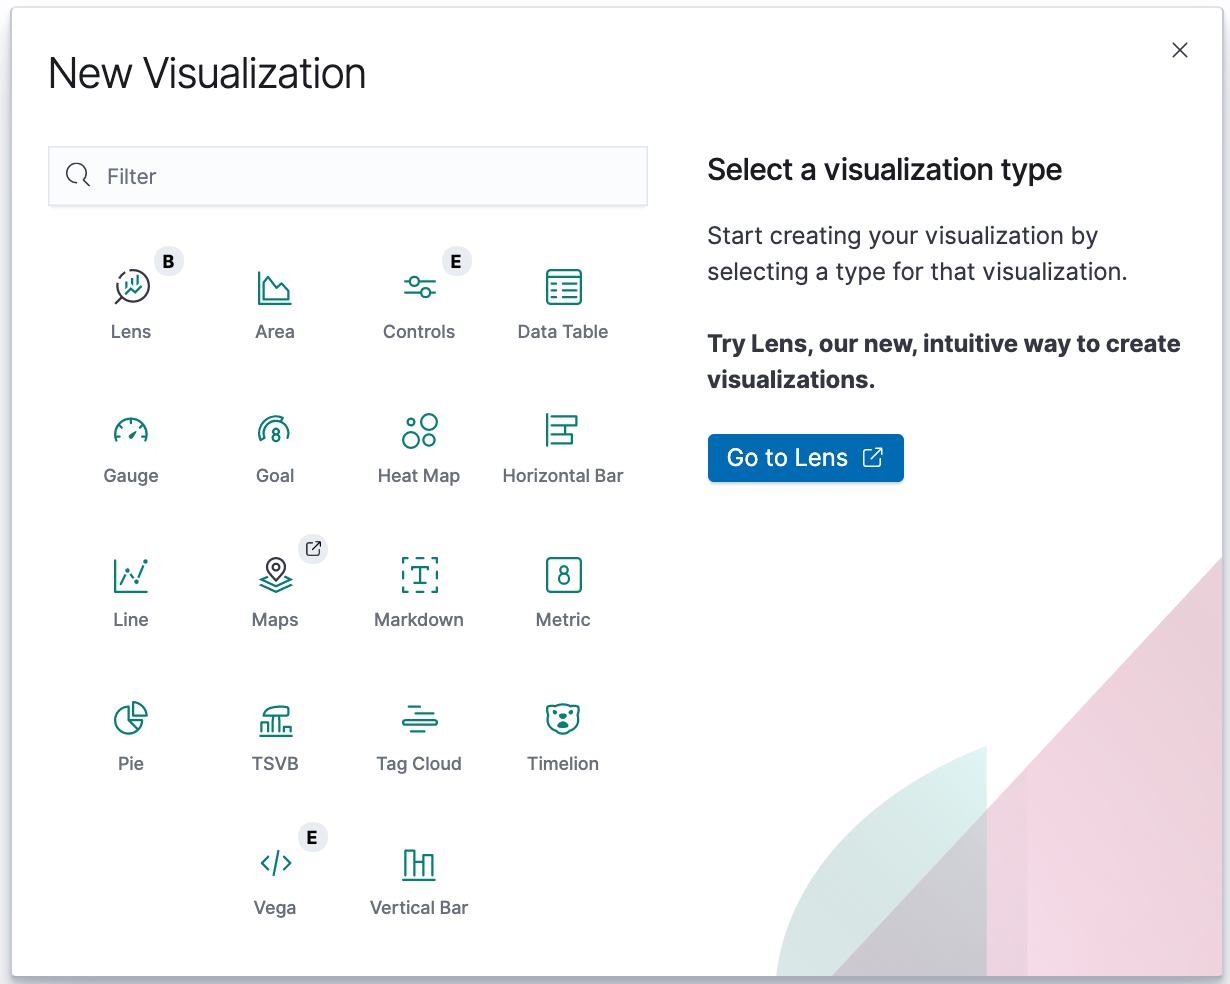
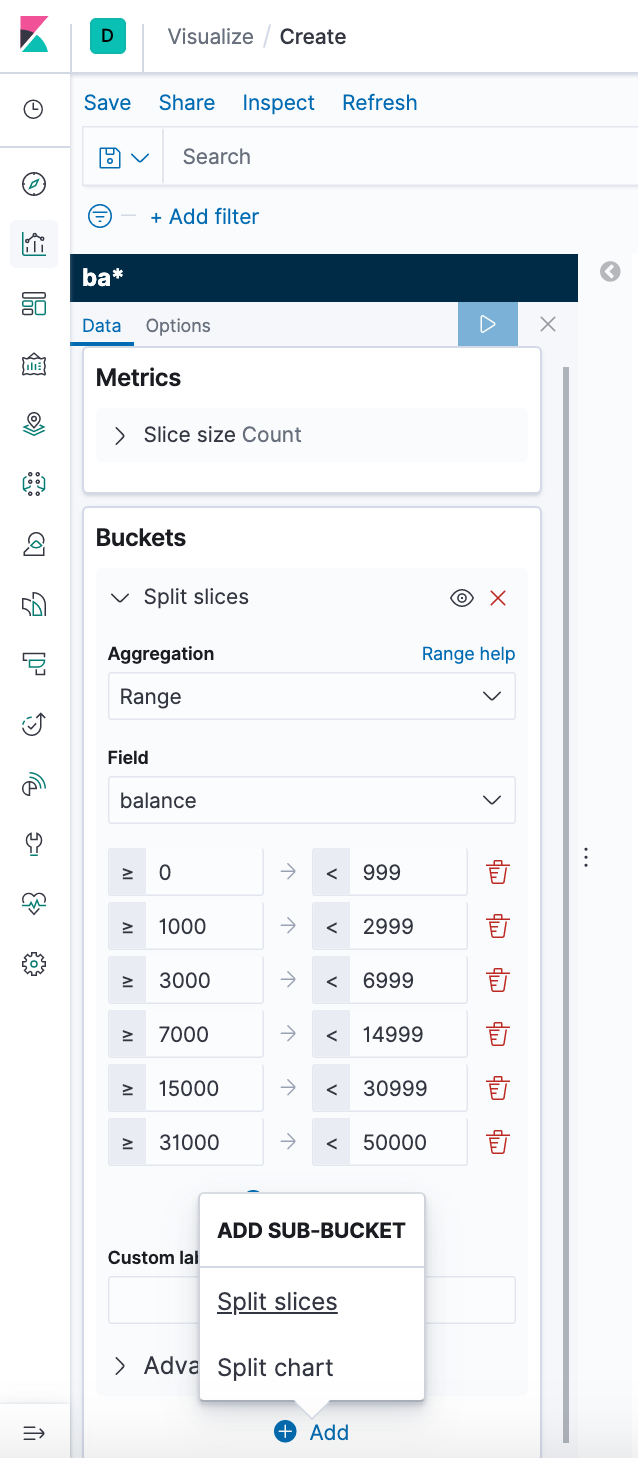
We'll use a bar chart to look at the Shakespeare data set and compare the number of speaking parts in the plays.
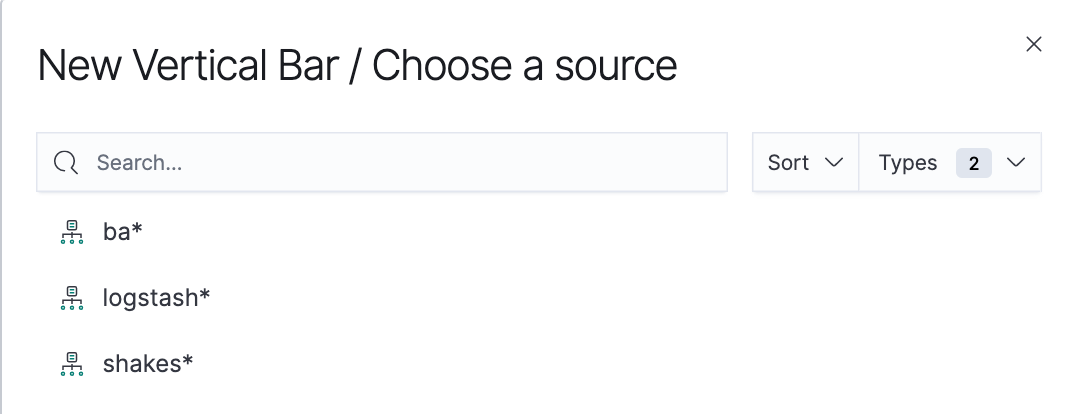
- Create a Vertical Bar chart and set the search source to shakes*.
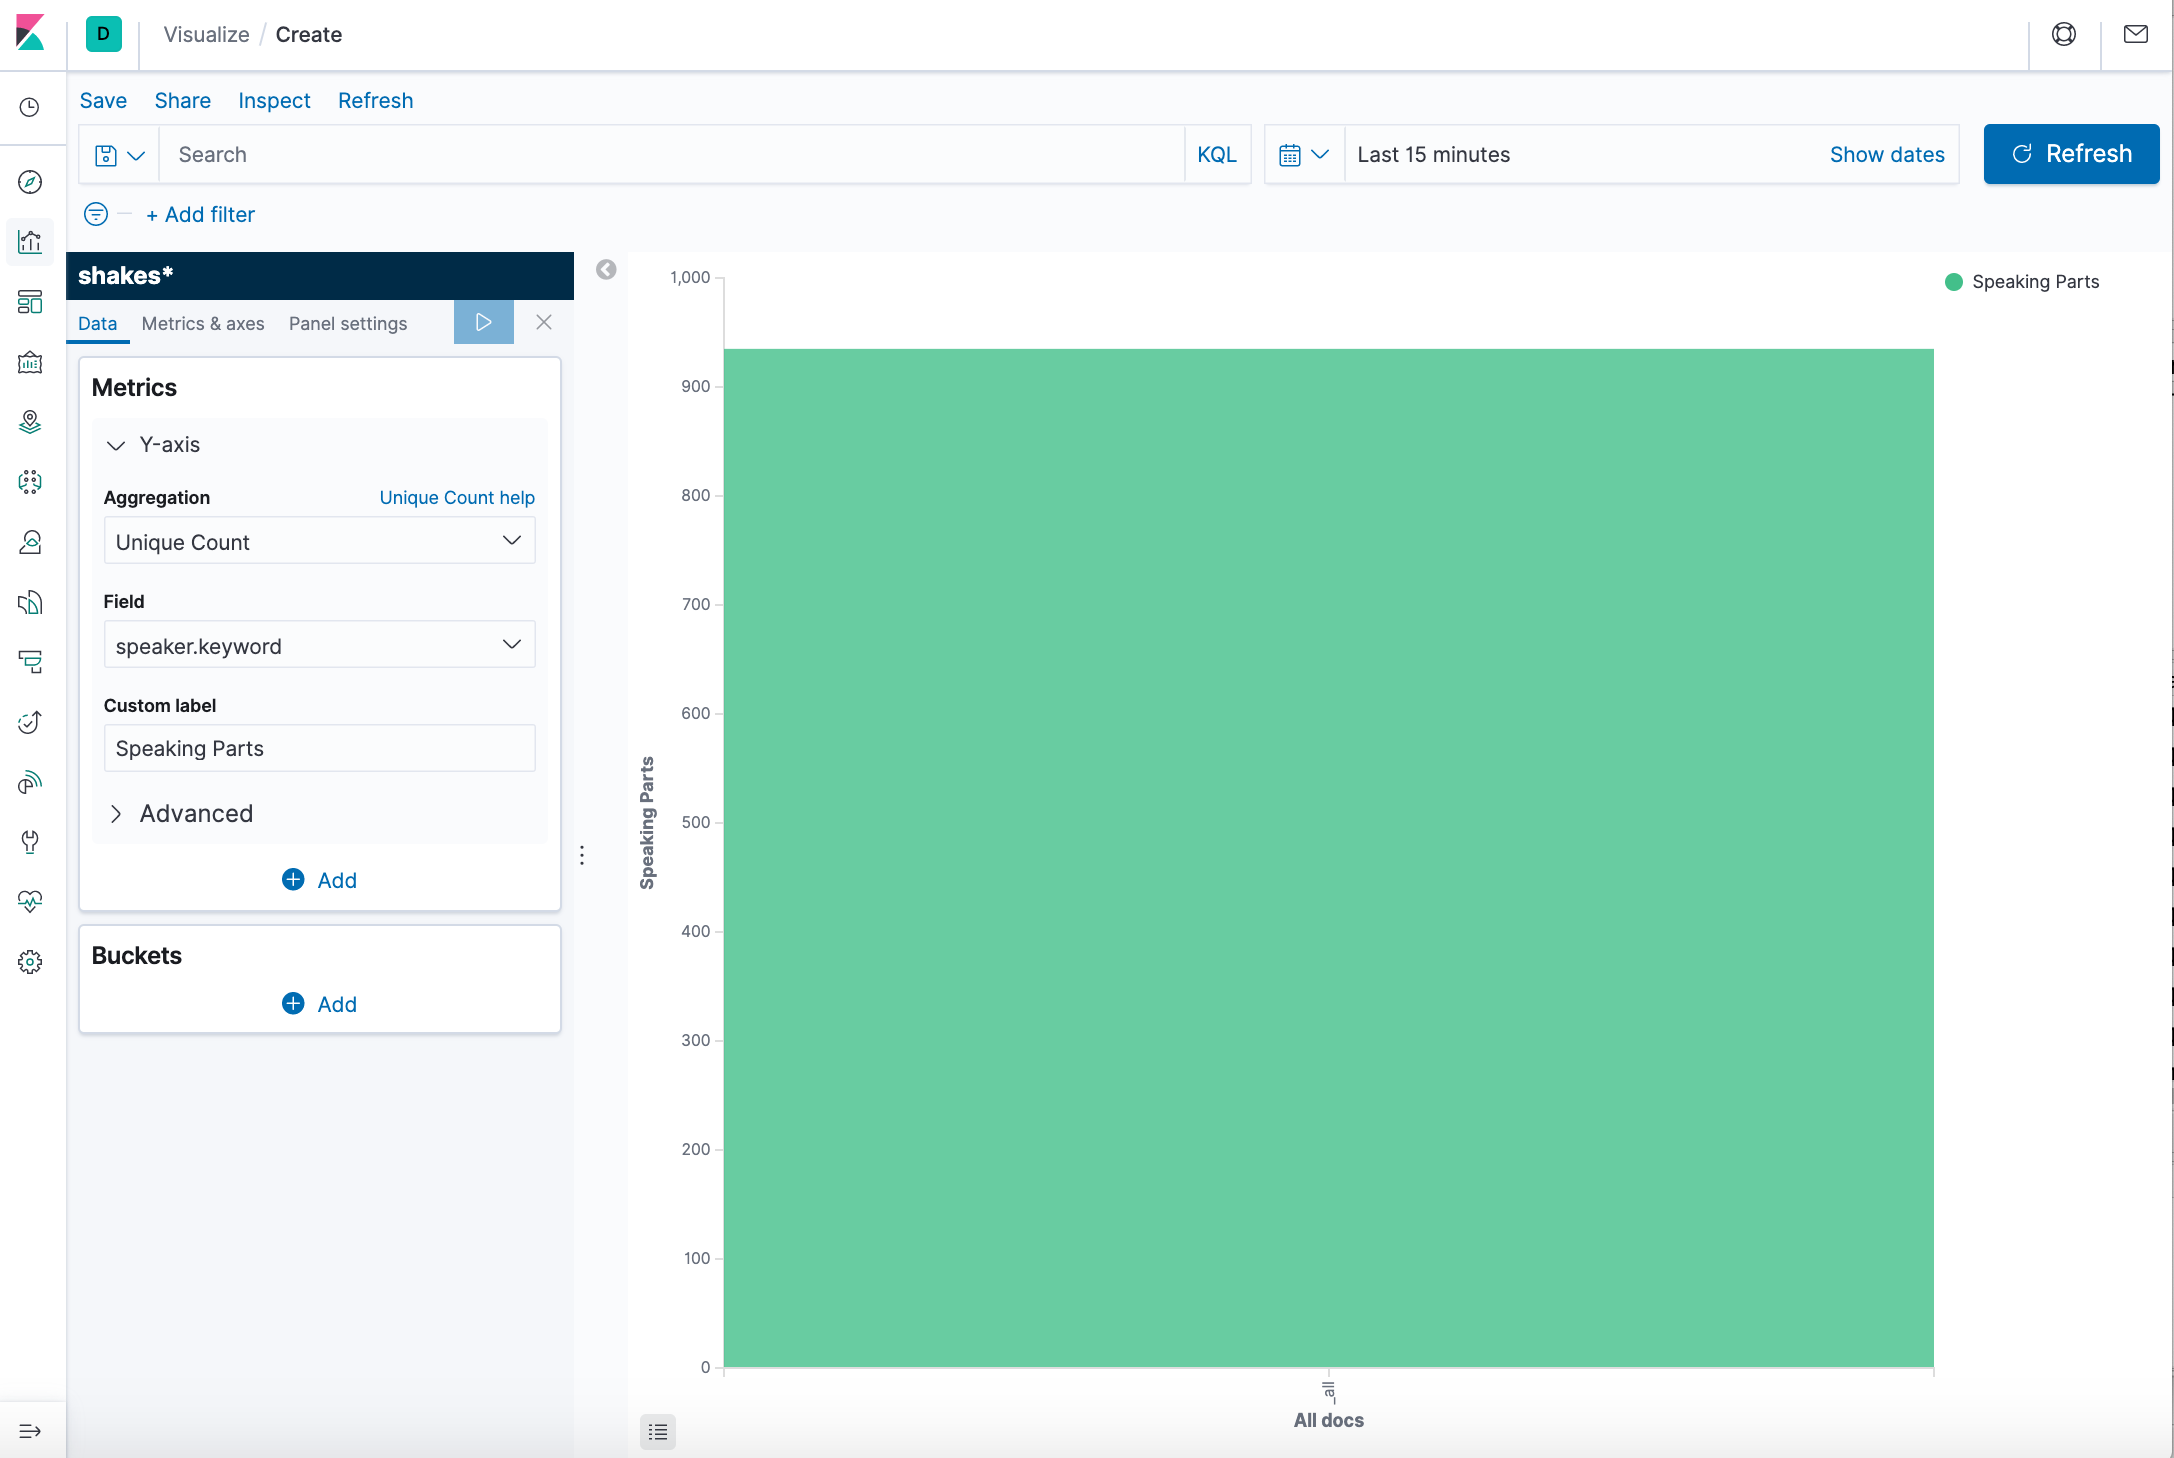
Initially, the chart is a single bar that shows the total count of documents that match the default wildcard query. - Show the number of speaking parts per play along the Y-axis.
- In the Metrics pane, expand Y-axis.
- Set Aggregation to Unique Count.
- Set Field to speaker.
- In the Custom label box, enter Speaking Parts.
- Click Apply changes.
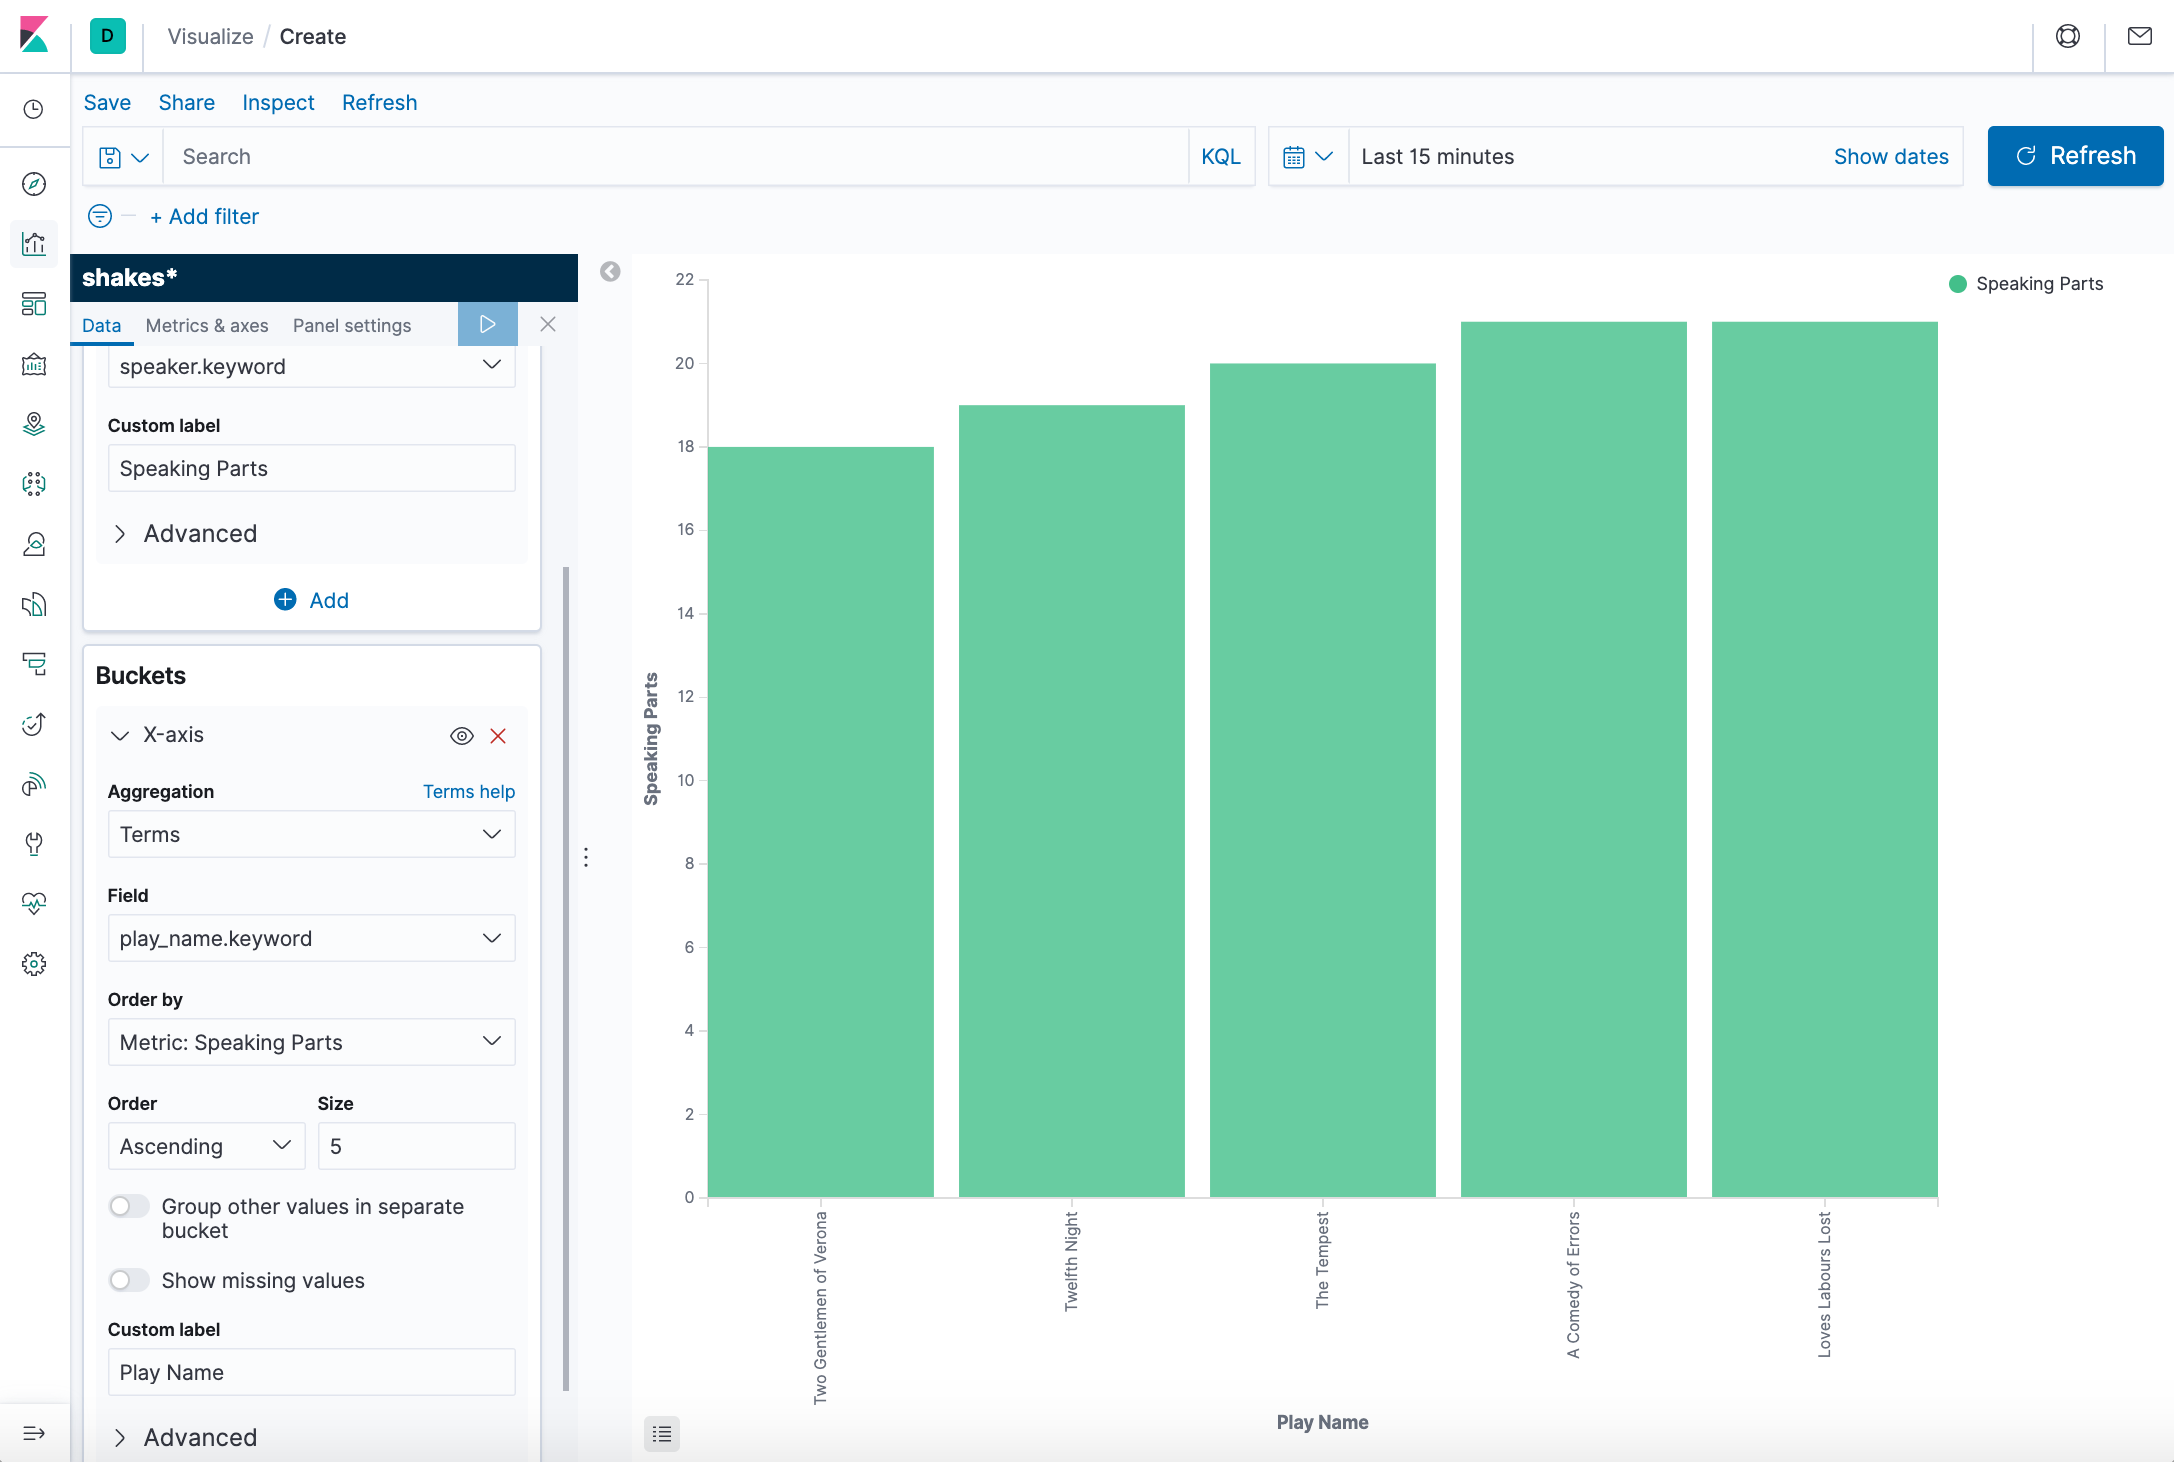
- Show the plays along the X-axis.
- In the Buckets pane, click Add > X-axis.
- Set Aggregation to Terms.
- Set Field to play_name.
- To list plays alphabetically, in the Order dropdown, select Ascending.
- Give the axis a custom label, Play Name.
- Click Apply changes.
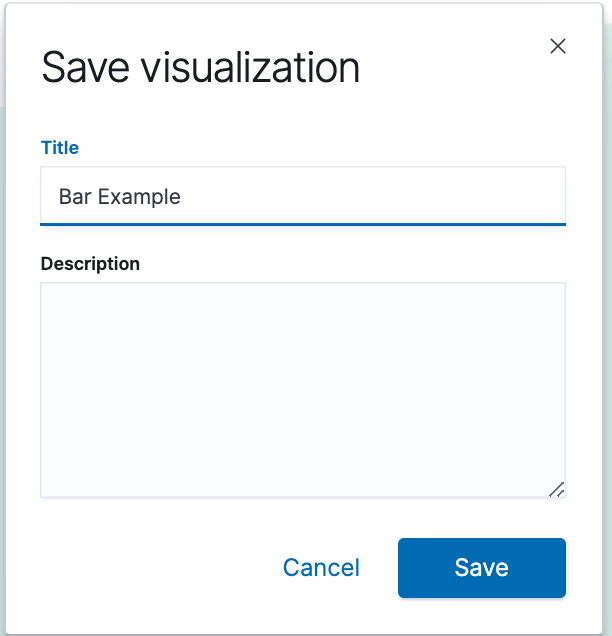
- Save this chart with the name Bar Example.
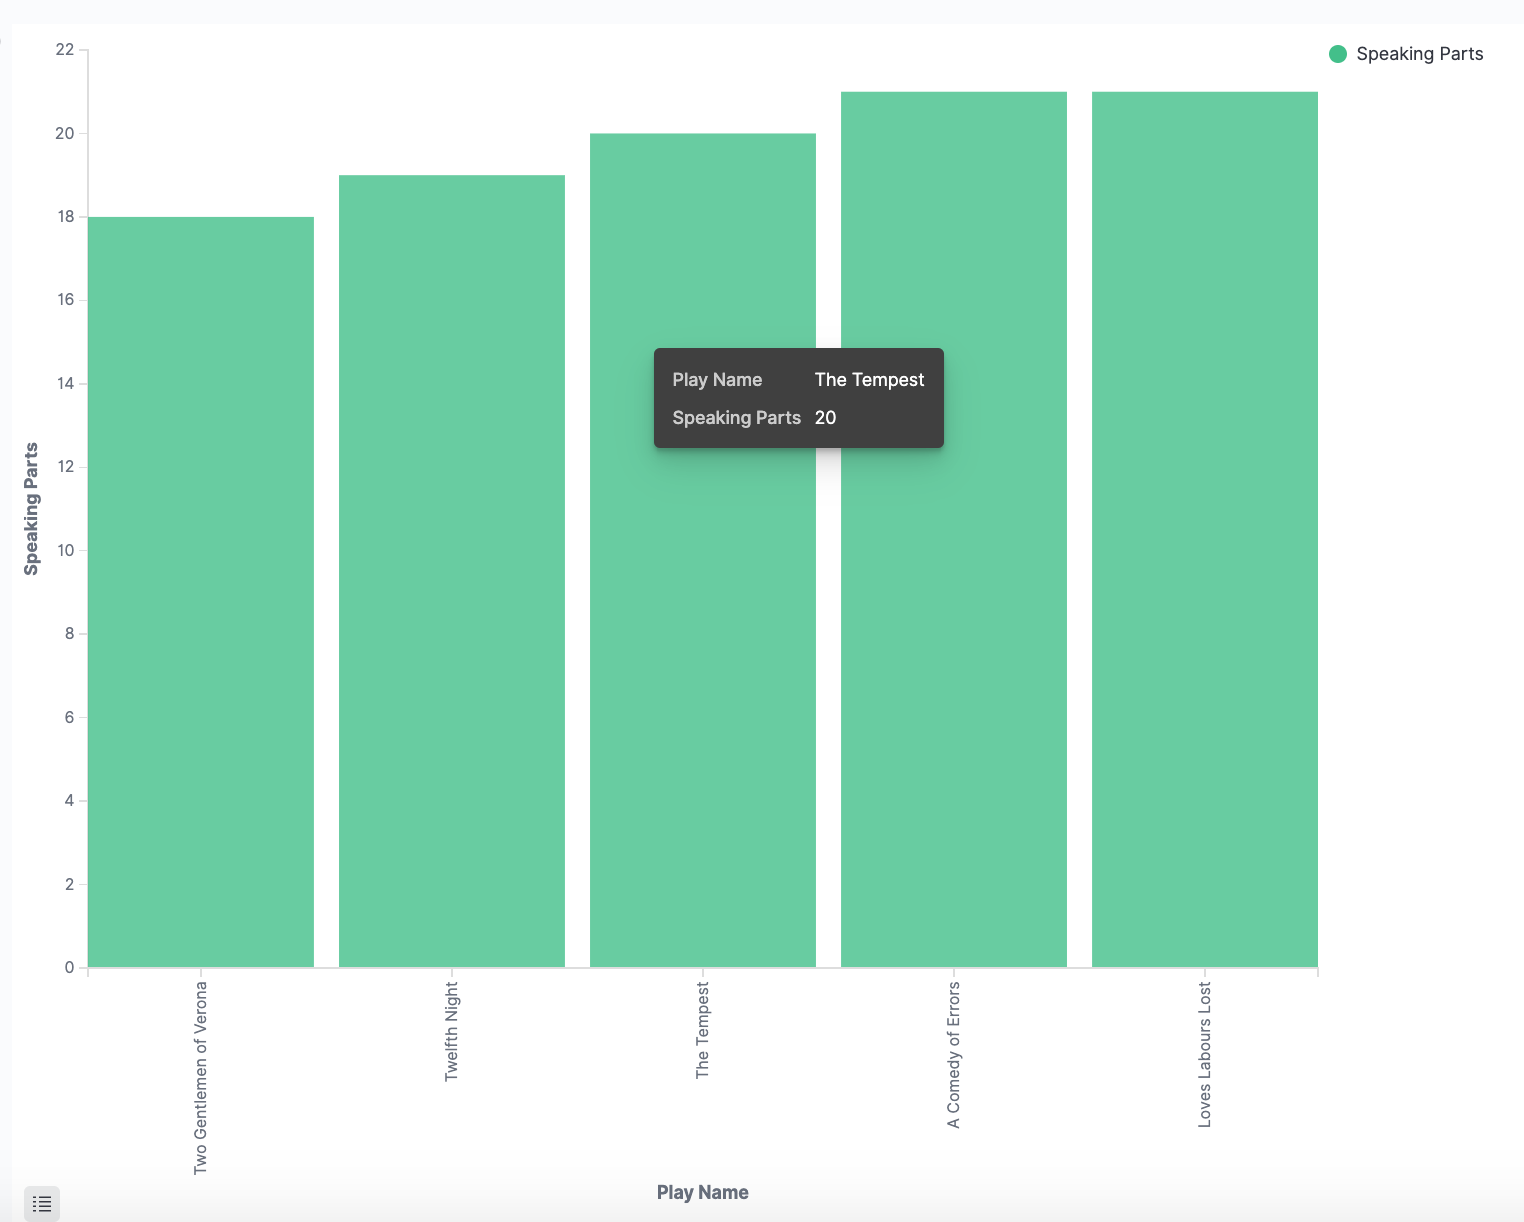
Hovering over a bar shows a tooltip with the number of speaking parts for that play. Notice how the individual play names show up as whole phrases, instead of broken into individual words. This is the result of the mapping WE did at the beginning of the tutorial, when WE marked the play_name field as not analyzed.
Let's create a Markdown widget to add formatted text to our dashboard.
- Create a Markdown visualization.
- Copy the following text into the text box.
- Click Apply changes. Then, the Markdown renders in the preview pane.
- Save this visualization with the name Markdown Example.
# This is a tutorial dashboard!
The Markdown widget uses **markdown** syntax.
> Blockquotes in Markdown use the > character.

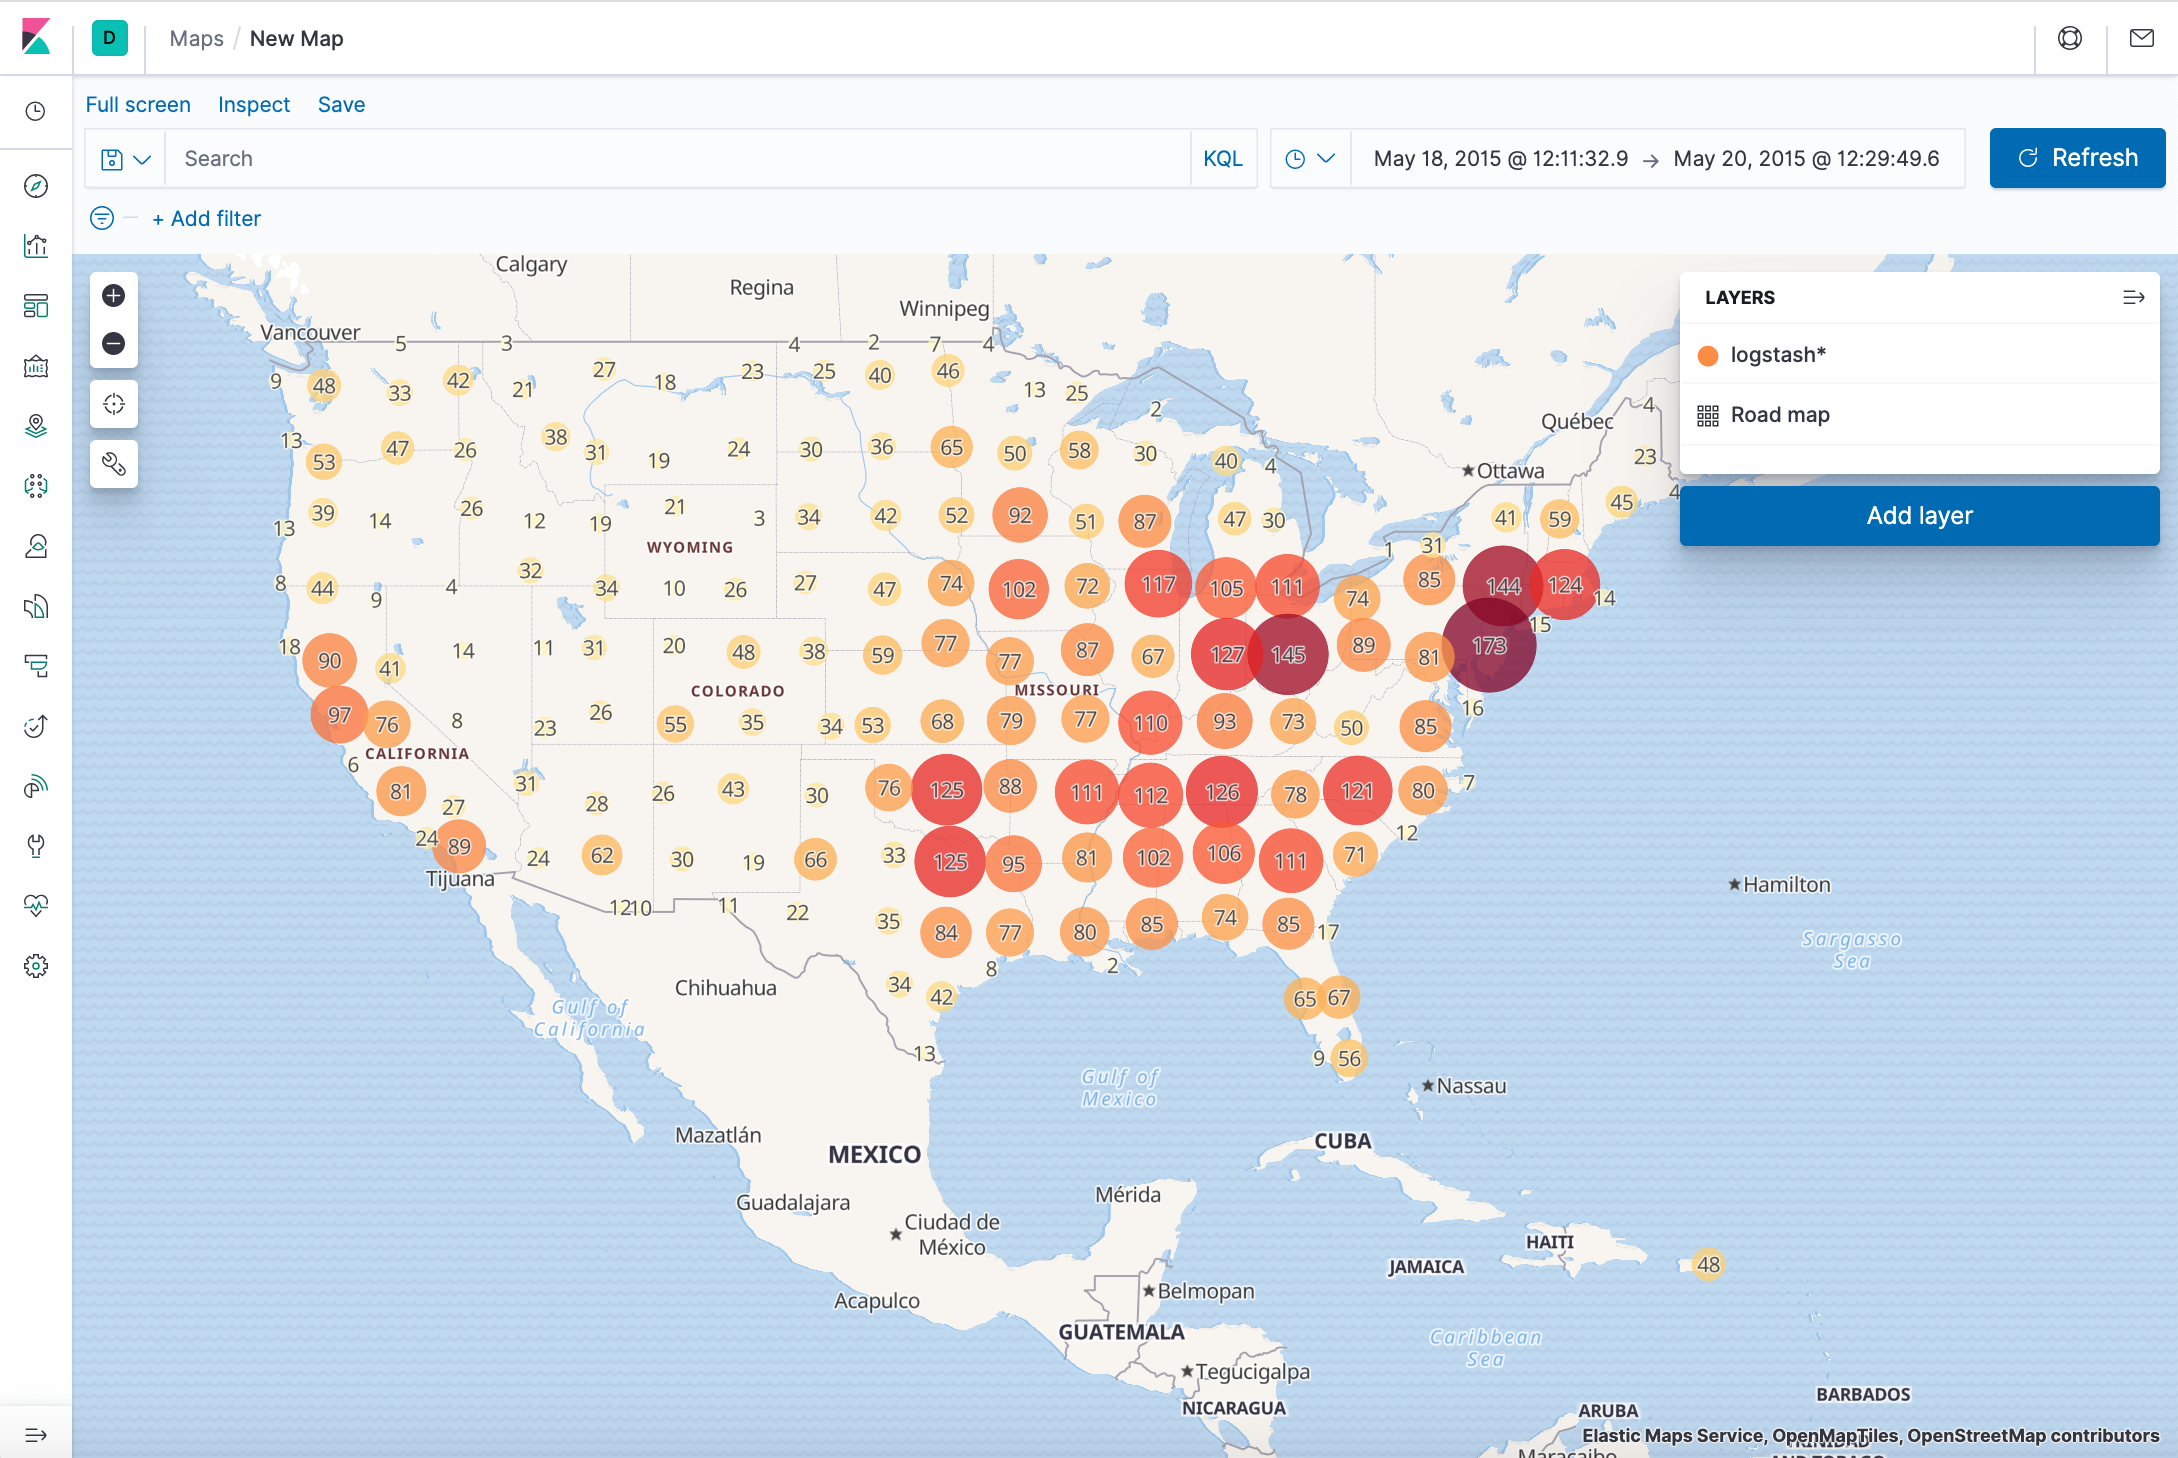
Using Elastic Maps, we can visualize geographic information in the log file sample data.
- Click Maps in the New Visualization menu to create a Map.
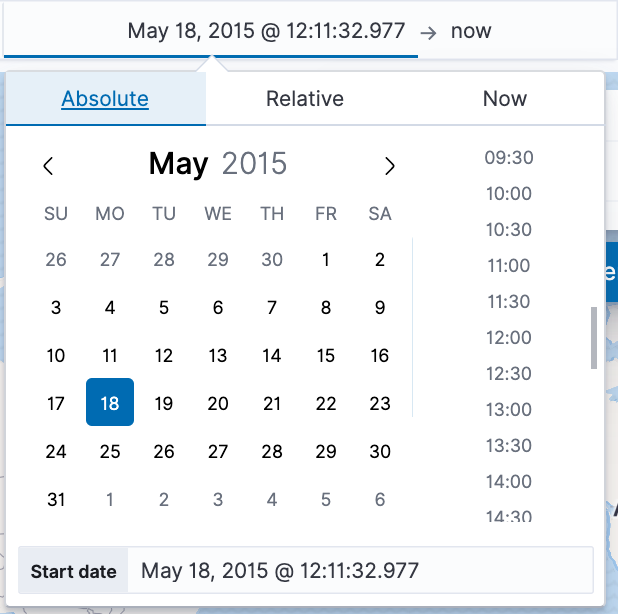
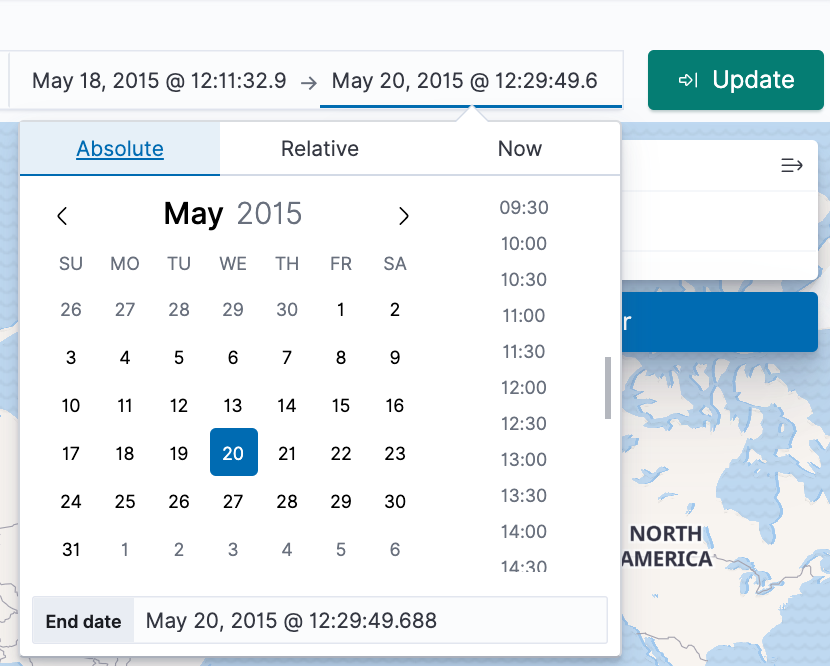
- Set the time.
- In the time filter, click Show dates.
- Click the start date, then Absolute.
- Set the Start date to May 18, 2015.
- In the time filter, click now, then Absolute.
- Set the End date to May 20, 2015.
- Click Update
- Map the geo coordinates from the log files.
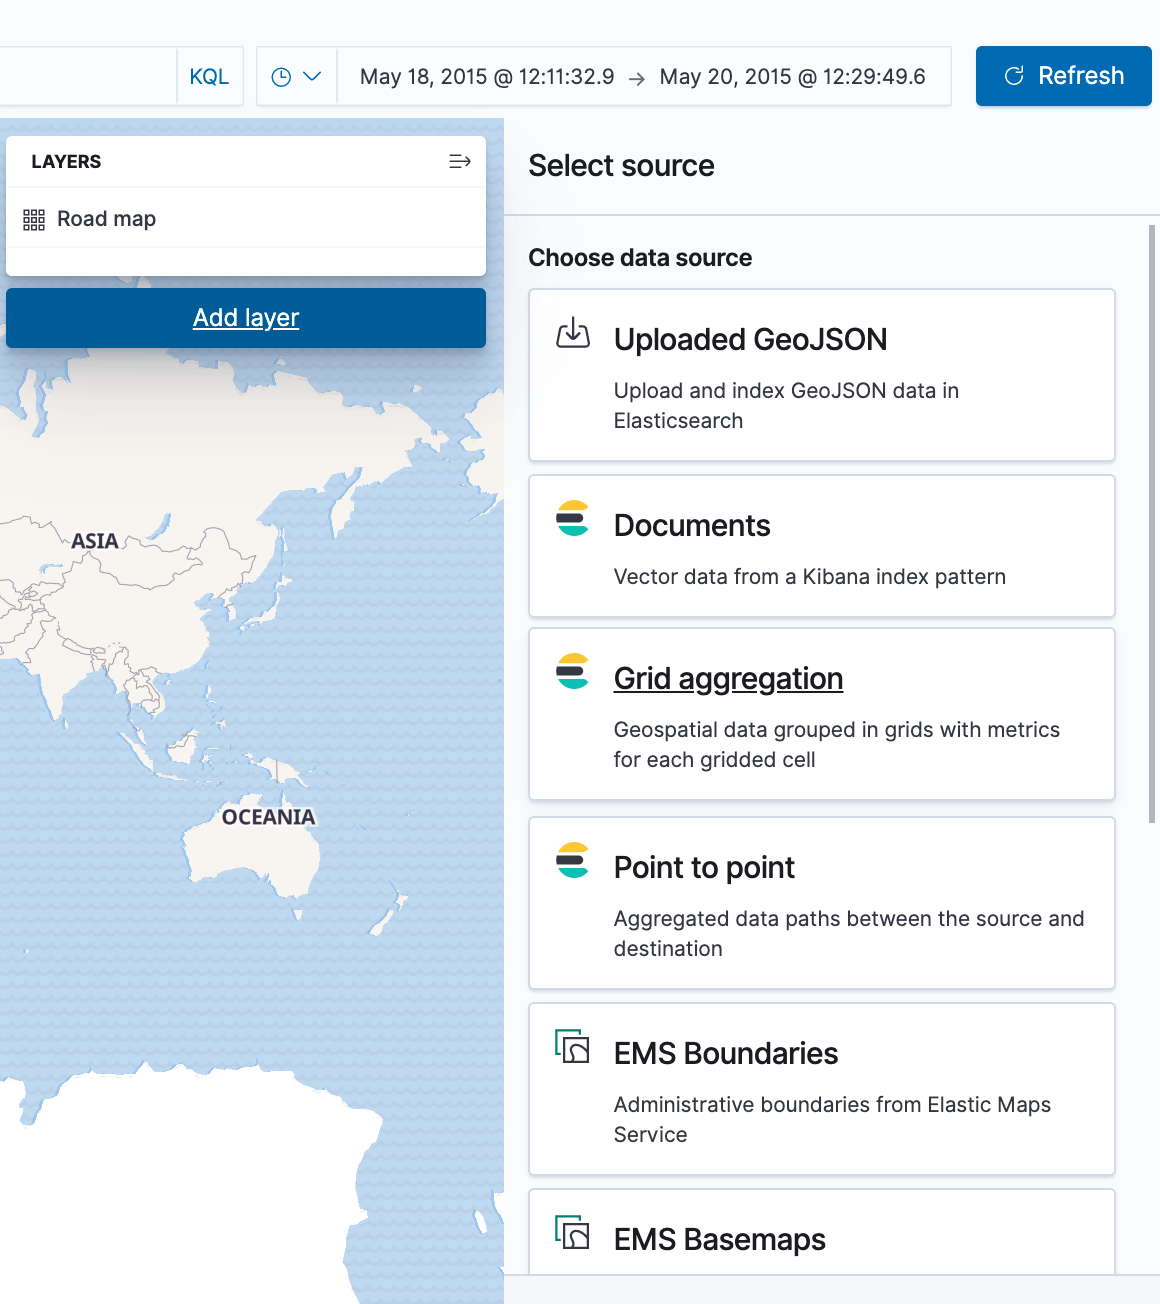
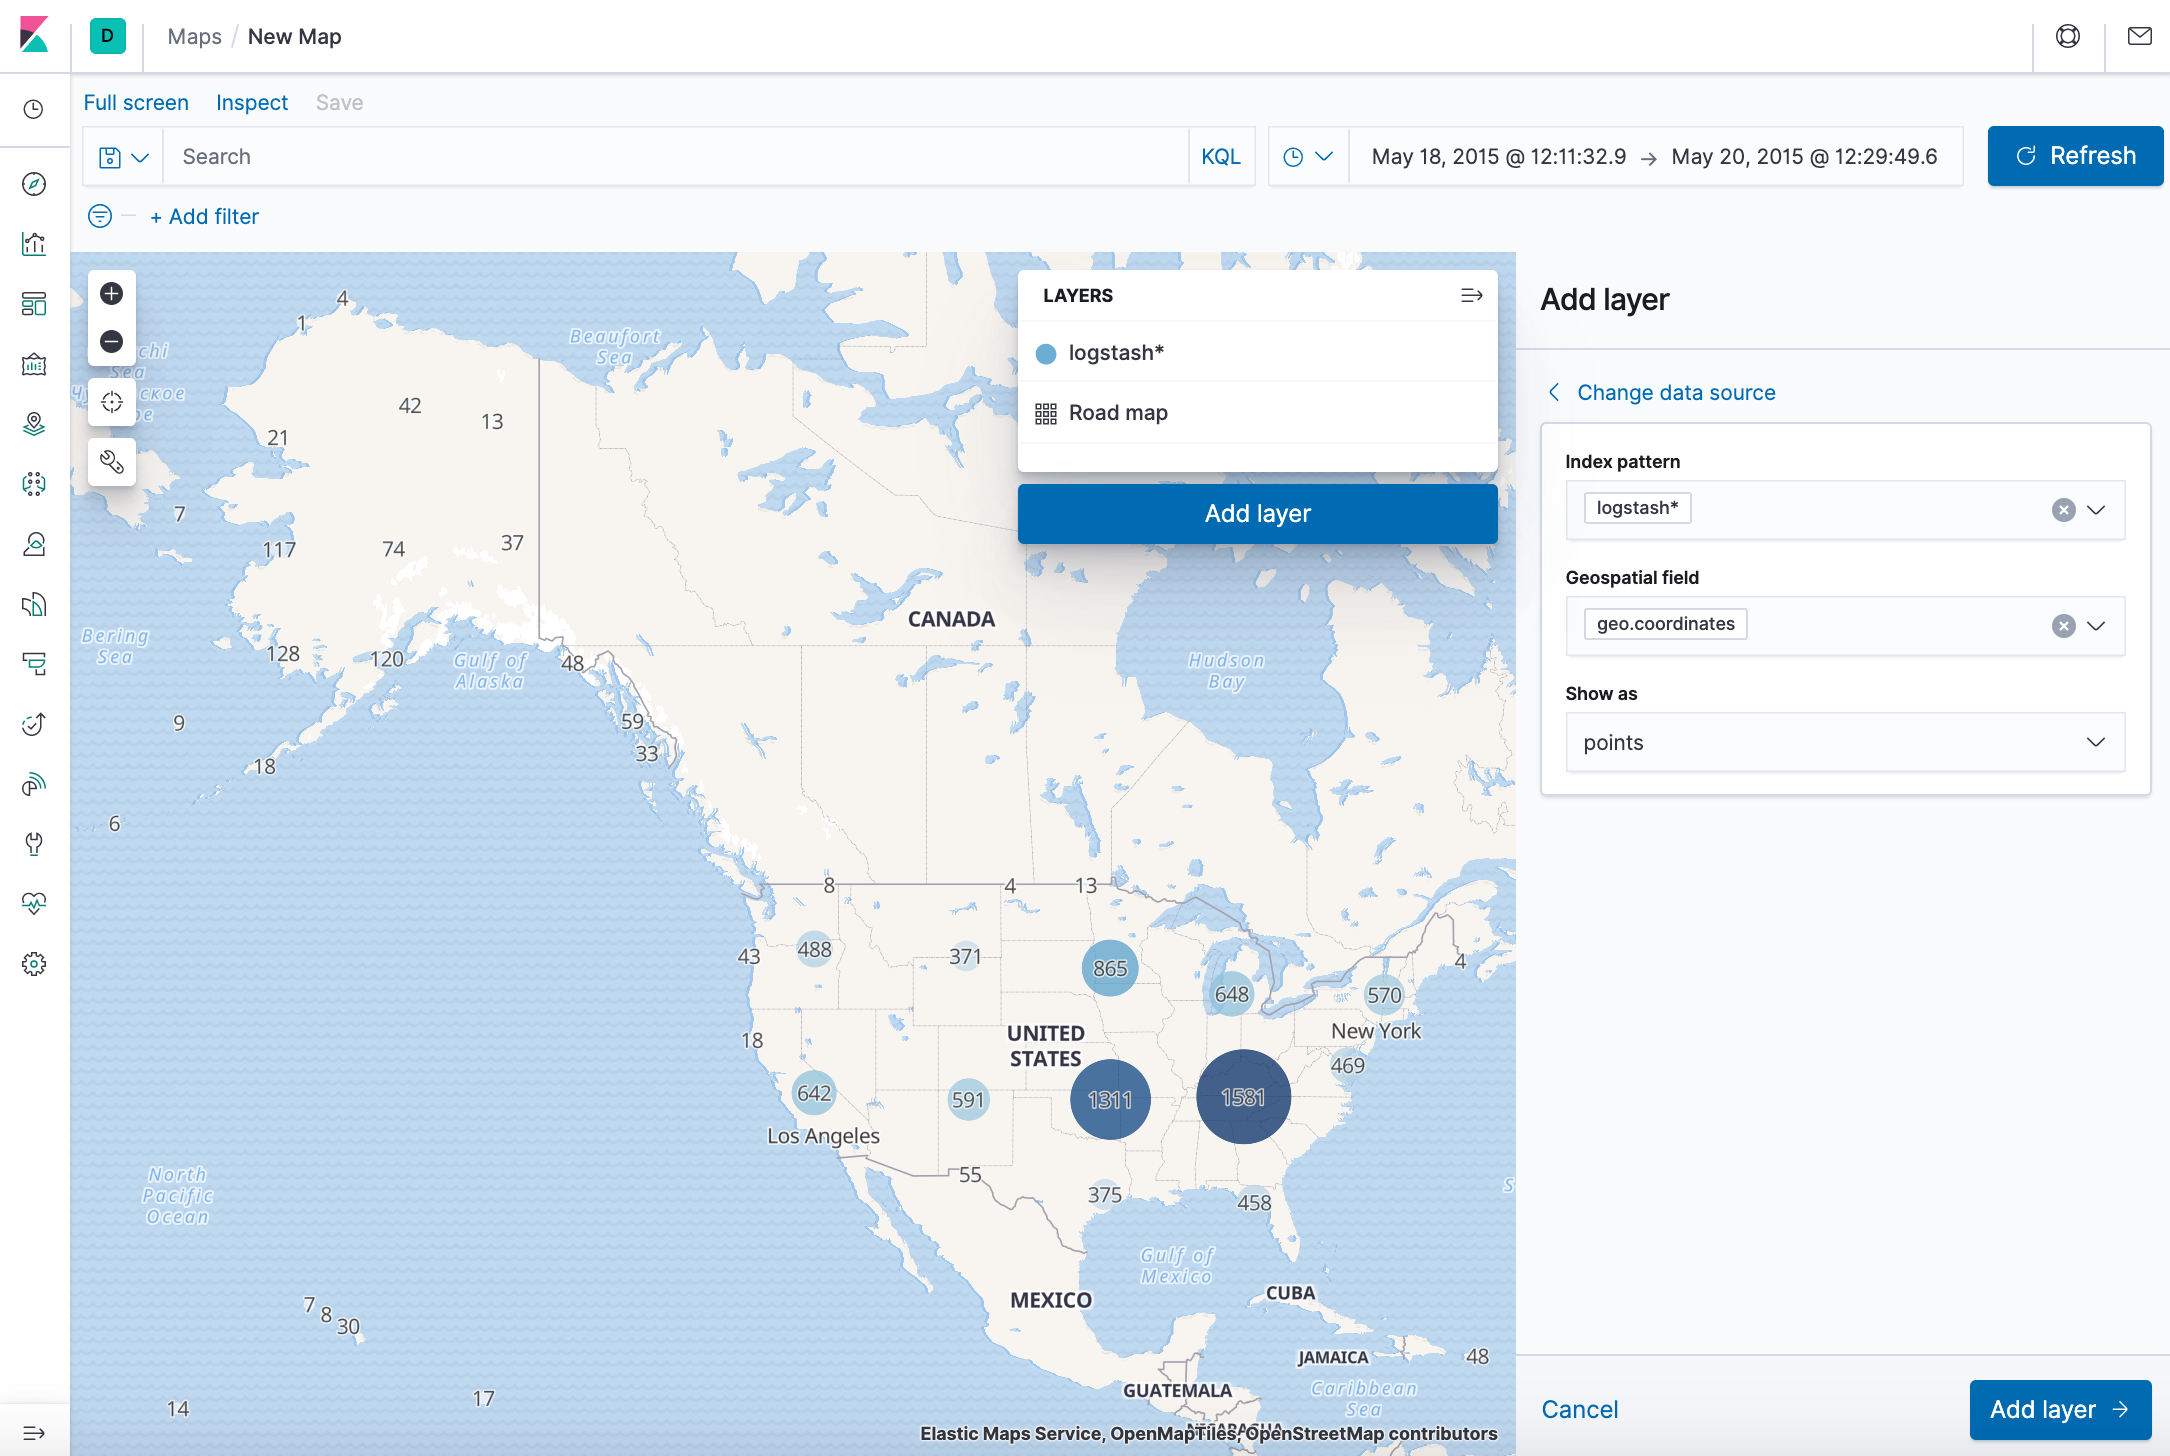
- Click Add layer.
- Click the Grid aggregation data source.
- Set Index pattern to logstash.
- Set Show as to points.
- Click the Add layer button.
- Set the layer style.
- For Fill color, select the yellow to red color ramp.
- For Border color, select white.
- Click Save & close.
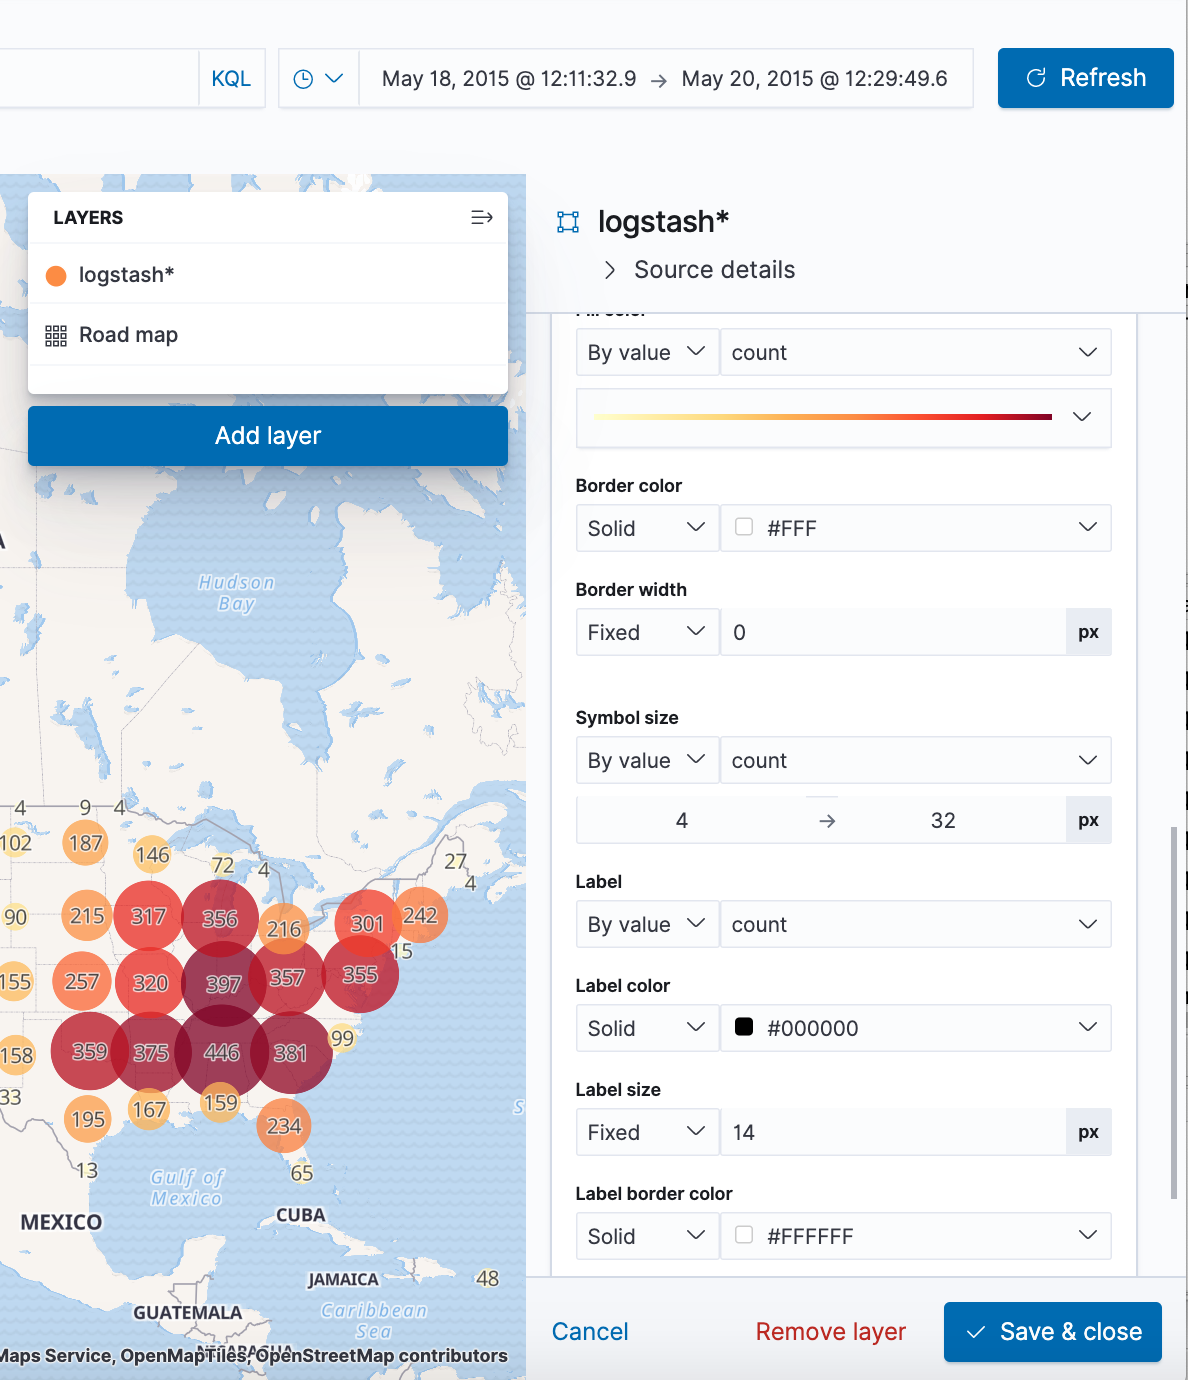
- Navigate the map by clicking and dragging. Use the controls to zoom the map and set filters.
- Save this map with the name Map Example.
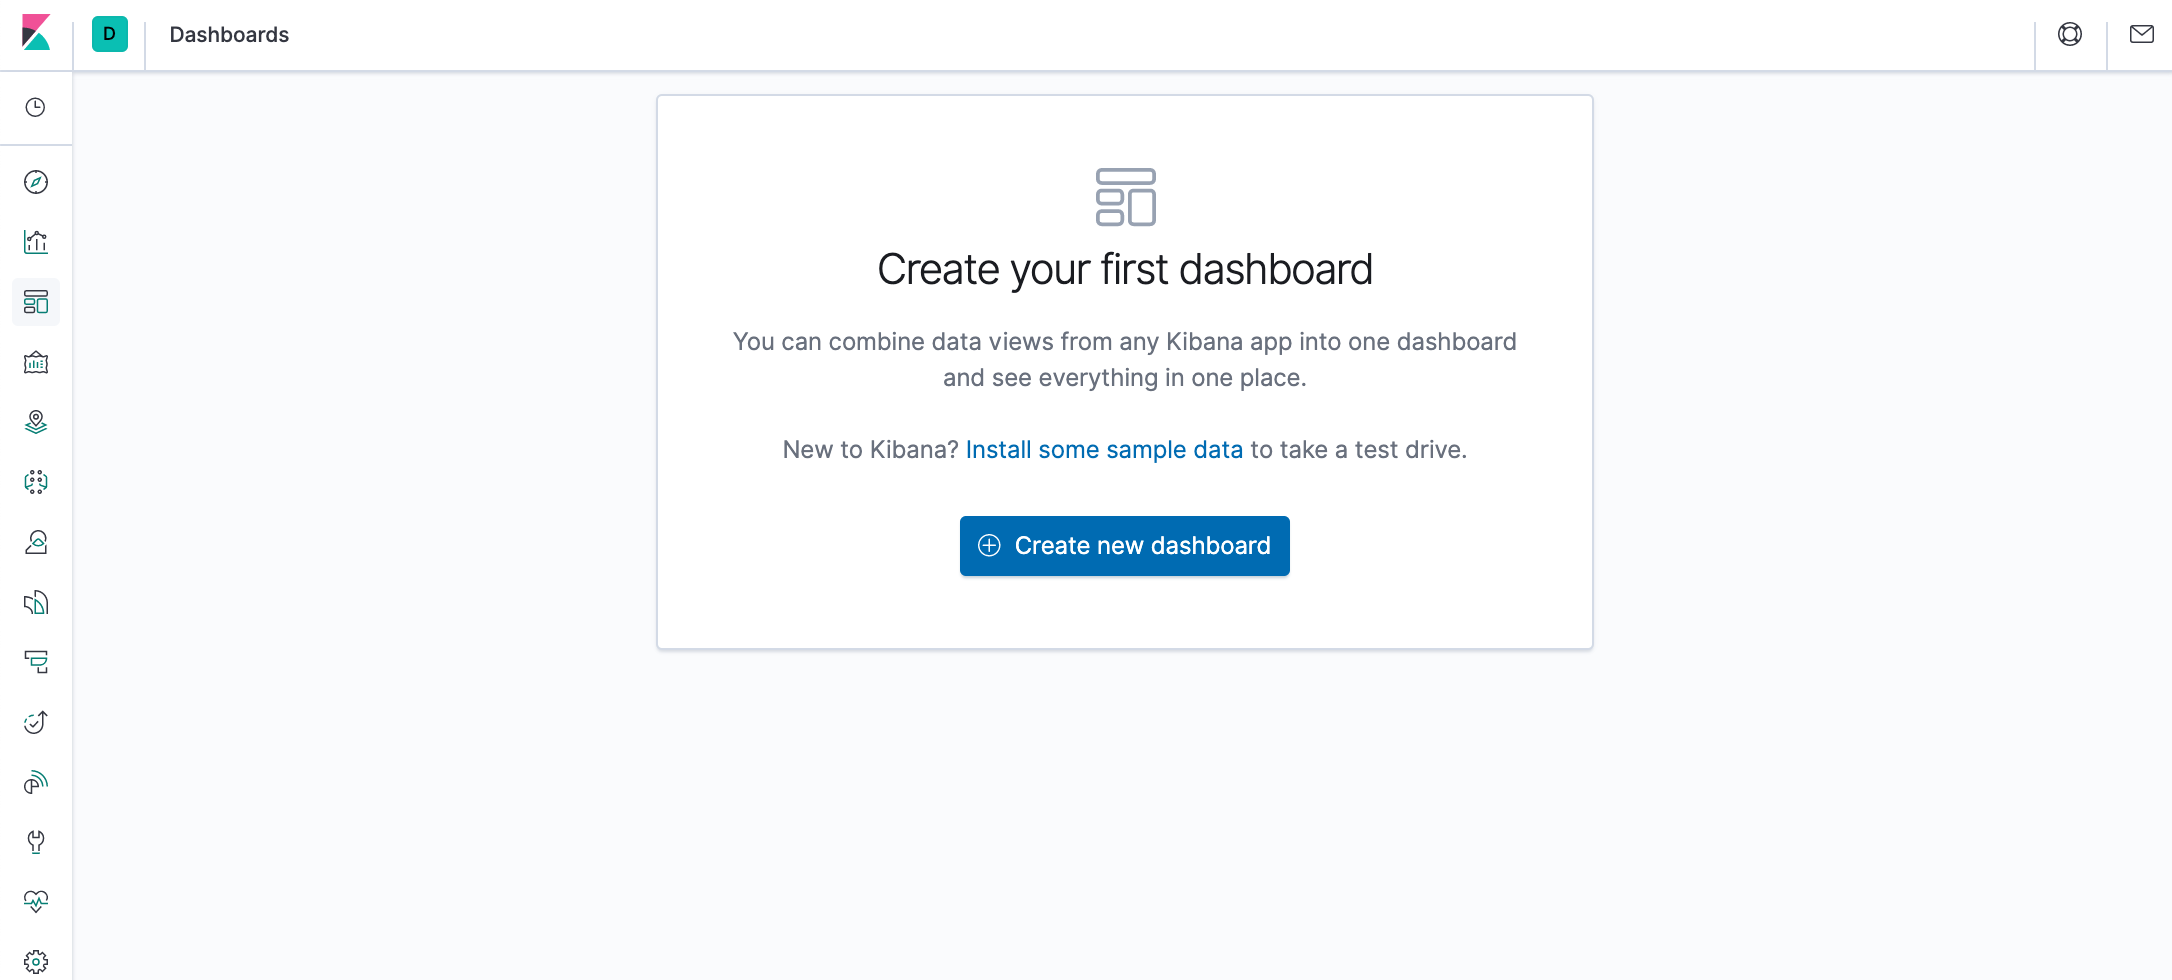
A dashboard is a collection of visualizations that we can arrange and share. We'll build a dashboard that contains the visualizations and map that we saved during this tutorial.
- Open Dashboard.
- On the Dashboard overview page, click Create new dashboard.
- Set the time filter to May 18, 2015 to May 20, 2015.
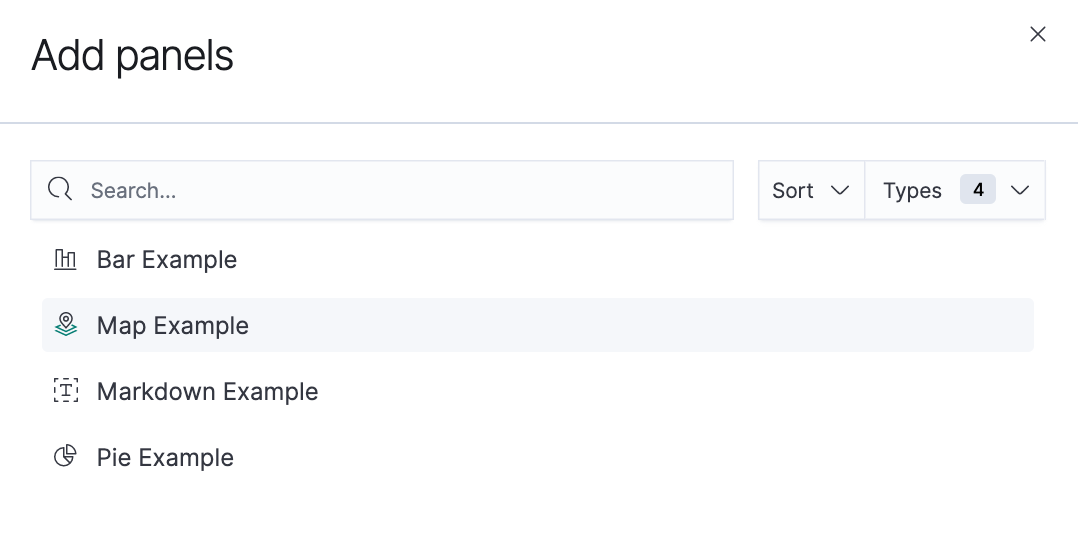
- Click Add in the menu bar.
- Add Bar Example, Map Example, Markdown Example, and Pie Example.
- Our sample dashboard should look like this:
- We can rearrange the visualizations by clicking a the header of a visualization and dragging. The gear icon in the top right of a visualization displays controls for editing and deleting the visualization. A resize control is on the lower right.
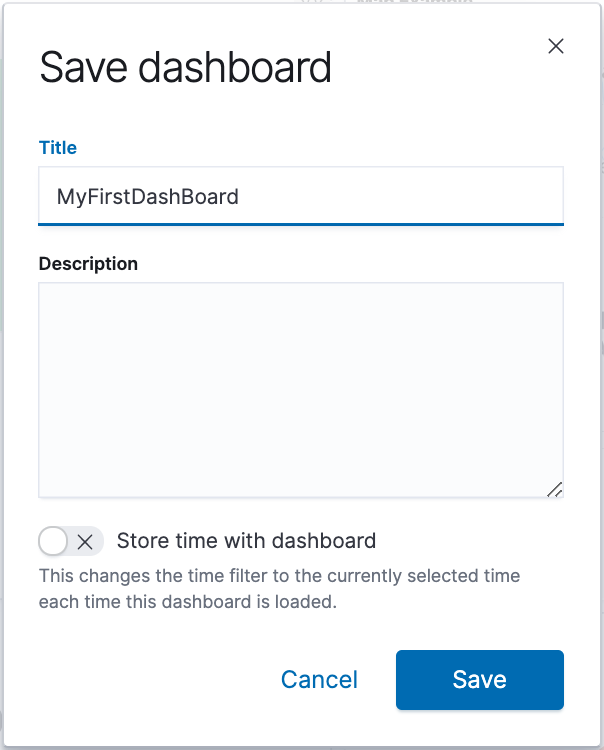
- Save the dashboard.

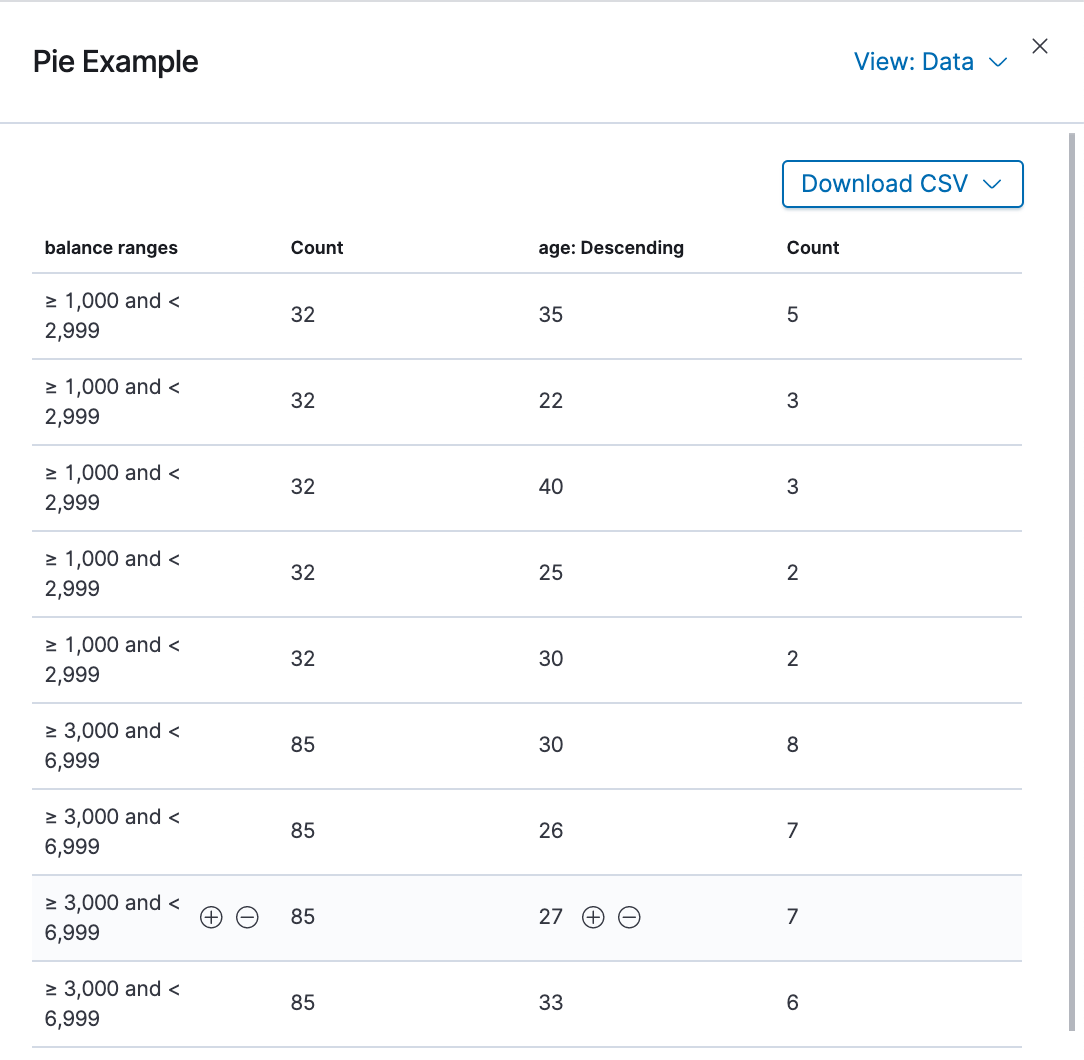
Seeing visualizations of our data is great, but sometimes we need to look at the actual data to understand what's really going on. We can inspect the data behind any visualization and view the Elasticsearch query used to retrieve it.
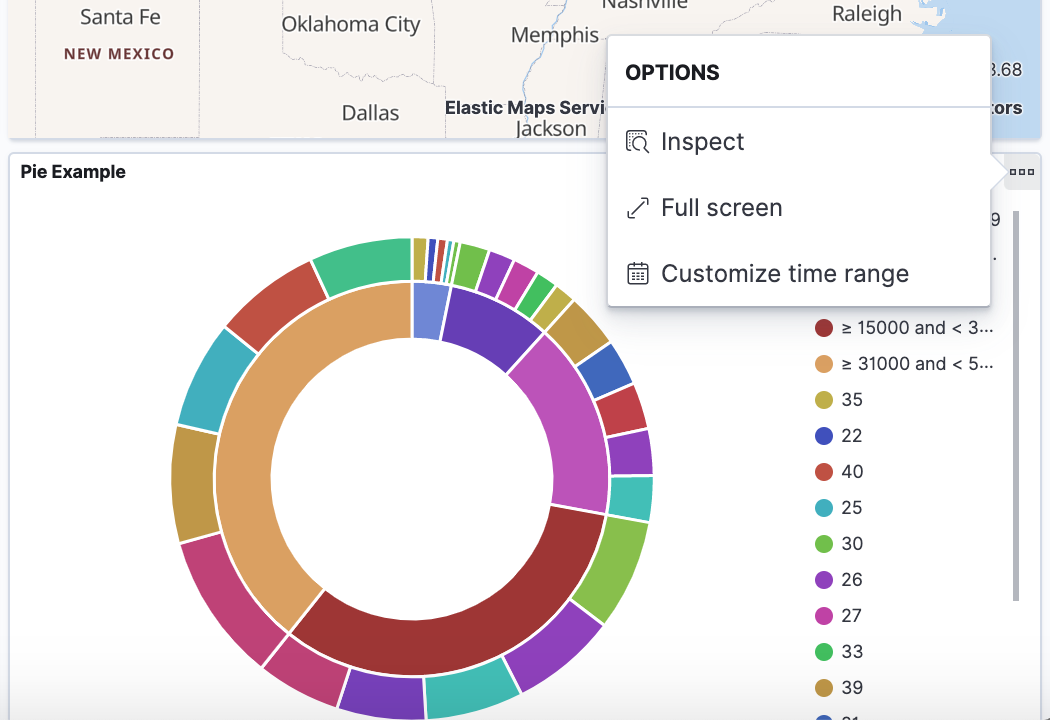
- In the dashboard, hover the pointer over the pie chart, and then click the icon in the upper right.
- From the Options menu, select Inspect.
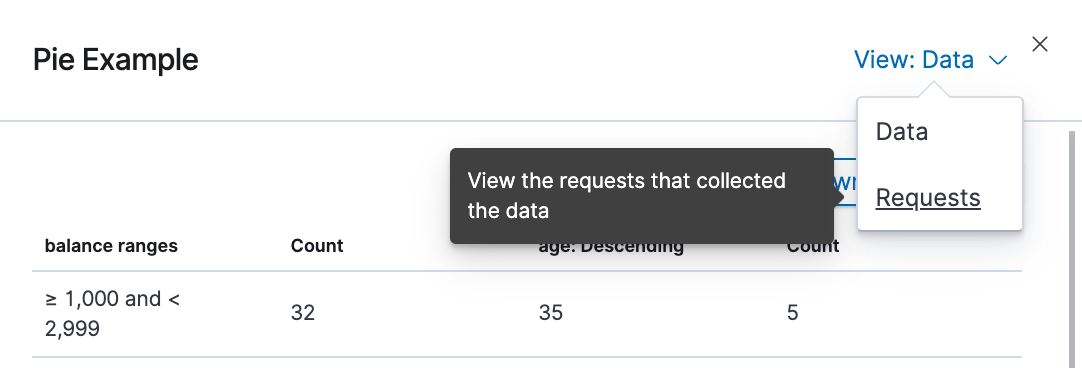
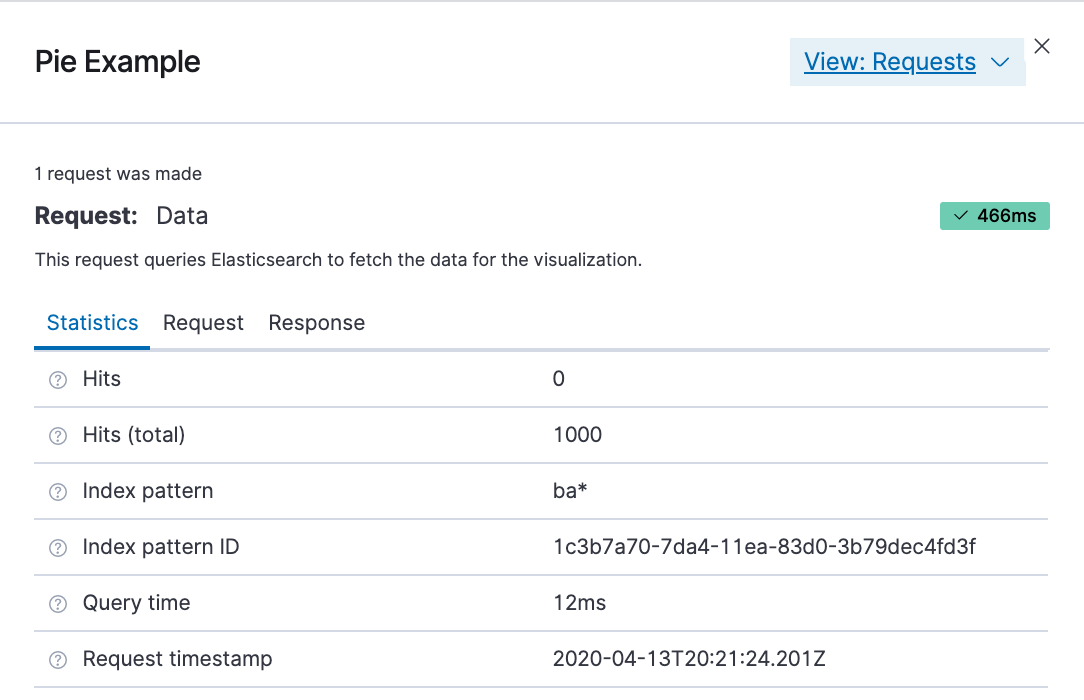
- To look at the query used to fetch the data for the visualization, select View > Requests in the upper right of the Inspect pane.
Docker & K8s
- Docker install on Amazon Linux AMI
- Docker install on EC2 Ubuntu 14.04
- Docker container vs Virtual Machine
- Docker install on Ubuntu 14.04
- Docker Hello World Application
- Nginx image - share/copy files, Dockerfile
- Working with Docker images : brief introduction
- Docker image and container via docker commands (search, pull, run, ps, restart, attach, and rm)
- More on docker run command (docker run -it, docker run --rm, etc.)
- Docker Networks - Bridge Driver Network
- Docker Persistent Storage
- File sharing between host and container (docker run -d -p -v)
- Linking containers and volume for datastore
- Dockerfile - Build Docker images automatically I - FROM, MAINTAINER, and build context
- Dockerfile - Build Docker images automatically II - revisiting FROM, MAINTAINER, build context, and caching
- Dockerfile - Build Docker images automatically III - RUN
- Dockerfile - Build Docker images automatically IV - CMD
- Dockerfile - Build Docker images automatically V - WORKDIR, ENV, ADD, and ENTRYPOINT
- Docker - Apache Tomcat
- Docker - NodeJS
- Docker - NodeJS with hostname
- Docker Compose - NodeJS with MongoDB
- Docker - Prometheus and Grafana with Docker-compose
- Docker - StatsD/Graphite/Grafana
- Docker - Deploying a Java EE JBoss/WildFly Application on AWS Elastic Beanstalk Using Docker Containers
- Docker : NodeJS with GCP Kubernetes Engine
- Docker : Jenkins Multibranch Pipeline with Jenkinsfile and Github
- Docker : Jenkins Master and Slave
- Docker - ELK : ElasticSearch, Logstash, and Kibana
- Docker - ELK 7.6 : Elasticsearch on Centos 7
- Docker - ELK 7.6 : Filebeat on Centos 7
- Docker - ELK 7.6 : Logstash on Centos 7
- Docker - ELK 7.6 : Kibana on Centos 7
- Docker - ELK 7.6 : Elastic Stack with Docker Compose
- Docker - Deploy Elastic Cloud on Kubernetes (ECK) via Elasticsearch operator on minikube
- Docker - Deploy Elastic Stack via Helm on minikube
- Docker Compose - A gentle introduction with WordPress
- Docker Compose - MySQL
- MEAN Stack app on Docker containers : micro services
- MEAN Stack app on Docker containers : micro services via docker-compose
- Docker Compose - Hashicorp's Vault and Consul Part A (install vault, unsealing, static secrets, and policies)
- Docker Compose - Hashicorp's Vault and Consul Part B (EaaS, dynamic secrets, leases, and revocation)
- Docker Compose - Hashicorp's Vault and Consul Part C (Consul)
- Docker Compose with two containers - Flask REST API service container and an Apache server container
- Docker compose : Nginx reverse proxy with multiple containers
- Docker & Kubernetes : Envoy - Getting started
- Docker & Kubernetes : Envoy - Front Proxy
- Docker & Kubernetes : Ambassador - Envoy API Gateway on Kubernetes
- Docker Packer
- Docker Cheat Sheet
- Docker Q & A #1
- Kubernetes Q & A - Part I
- Kubernetes Q & A - Part II
- Docker - Run a React app in a docker
- Docker - Run a React app in a docker II (snapshot app with nginx)
- Docker - NodeJS and MySQL app with React in a docker
- Docker - Step by Step NodeJS and MySQL app with React - I
- Installing LAMP via puppet on Docker
- Docker install via Puppet
- Nginx Docker install via Ansible
- Apache Hadoop CDH 5.8 Install with QuickStarts Docker
- Docker - Deploying Flask app to ECS
- Docker Compose - Deploying WordPress to AWS
- Docker - WordPress Deploy to ECS with Docker-Compose (ECS-CLI EC2 type)
- Docker - WordPress Deploy to ECS with Docker-Compose (ECS-CLI Fargate type)
- Docker - ECS Fargate
- Docker - AWS ECS service discovery with Flask and Redis
- Docker & Kubernetes : minikube
- Docker & Kubernetes 2 : minikube Django with Postgres - persistent volume
- Docker & Kubernetes 3 : minikube Django with Redis and Celery
- Docker & Kubernetes 4 : Django with RDS via AWS Kops
- Docker & Kubernetes : Kops on AWS
- Docker & Kubernetes : Ingress controller on AWS with Kops
- Docker & Kubernetes : HashiCorp's Vault and Consul on minikube
- Docker & Kubernetes : HashiCorp's Vault and Consul - Auto-unseal using Transit Secrets Engine
- Docker & Kubernetes : Persistent Volumes & Persistent Volumes Claims - hostPath and annotations
- Docker & Kubernetes : Persistent Volumes - Dynamic volume provisioning
- Docker & Kubernetes : DaemonSet
- Docker & Kubernetes : Secrets
- Docker & Kubernetes : kubectl command
- Docker & Kubernetes : Assign a Kubernetes Pod to a particular node in a Kubernetes cluster
- Docker & Kubernetes : Configure a Pod to Use a ConfigMap
- AWS : EKS (Elastic Container Service for Kubernetes)
- Docker & Kubernetes : Run a React app in a minikube
- Docker & Kubernetes : Minikube install on AWS EC2
- Docker & Kubernetes : Cassandra with a StatefulSet
- Docker & Kubernetes : Terraform and AWS EKS
- Docker & Kubernetes : Pods and Service definitions
- Docker & Kubernetes : Service IP and the Service Type
- Docker & Kubernetes : Kubernetes DNS with Pods and Services
- Docker & Kubernetes : Headless service and discovering pods
- Docker & Kubernetes : Scaling and Updating application
- Docker & Kubernetes : Horizontal pod autoscaler on minikubes
- Docker & Kubernetes : From a monolithic app to micro services on GCP Kubernetes
- Docker & Kubernetes : Rolling updates
- Docker & Kubernetes : Deployments to GKE (Rolling update, Canary and Blue-green deployments)
- Docker & Kubernetes : Slack Chat Bot with NodeJS on GCP Kubernetes
- Docker & Kubernetes : Continuous Delivery with Jenkins Multibranch Pipeline for Dev, Canary, and Production Environments on GCP Kubernetes
- Docker & Kubernetes : NodePort vs LoadBalancer vs Ingress
- Docker & Kubernetes : MongoDB / MongoExpress on Minikube
- Docker & Kubernetes : Load Testing with Locust on GCP Kubernetes
- Docker & Kubernetes : MongoDB with StatefulSets on GCP Kubernetes Engine
- Docker & Kubernetes : Nginx Ingress Controller on Minikube
- Docker & Kubernetes : Setting up Ingress with NGINX Controller on Minikube (Mac)
- Docker & Kubernetes : Nginx Ingress Controller for Dashboard service on Minikube
- Docker & Kubernetes : Nginx Ingress Controller on GCP Kubernetes
- Docker & Kubernetes : Kubernetes Ingress with AWS ALB Ingress Controller in EKS
- Docker & Kubernetes : Setting up a private cluster on GCP Kubernetes
- Docker & Kubernetes : Kubernetes Namespaces (default, kube-public, kube-system) and switching namespaces (kubens)
- Docker & Kubernetes : StatefulSets on minikube
- Docker & Kubernetes : RBAC
- Docker & Kubernetes Service Account, RBAC, and IAM
- Docker & Kubernetes - Kubernetes Service Account, RBAC, IAM with EKS ALB, Part 1
- Docker & Kubernetes : Helm Chart
- Docker & Kubernetes : My first Helm deploy
- Docker & Kubernetes : Readiness and Liveness Probes
- Docker & Kubernetes : Helm chart repository with Github pages
- Docker & Kubernetes : Deploying WordPress and MariaDB with Ingress to Minikube using Helm Chart
- Docker & Kubernetes : Deploying WordPress and MariaDB to AWS using Helm 2 Chart
- Docker & Kubernetes : Deploying WordPress and MariaDB to AWS using Helm 3 Chart
- Docker & Kubernetes : Helm Chart for Node/Express and MySQL with Ingress
- Docker & Kubernetes : Deploy Prometheus and Grafana using Helm and Prometheus Operator - Monitoring Kubernetes node resources out of the box
- Docker & Kubernetes : Deploy Prometheus and Grafana using kube-prometheus-stack Helm Chart
- Docker & Kubernetes : Istio (service mesh) sidecar proxy on GCP Kubernetes
- Docker & Kubernetes : Istio on EKS
- Docker & Kubernetes : Istio on Minikube with AWS EC2 for Bookinfo Application
- Docker & Kubernetes : Deploying .NET Core app to Kubernetes Engine and configuring its traffic managed by Istio (Part I)
- Docker & Kubernetes : Deploying .NET Core app to Kubernetes Engine and configuring its traffic managed by Istio (Part II - Prometheus, Grafana, pin a service, split traffic, and inject faults)
- Docker & Kubernetes : Helm Package Manager with MySQL on GCP Kubernetes Engine
- Docker & Kubernetes : Deploying Memcached on Kubernetes Engine
- Docker & Kubernetes : EKS Control Plane (API server) Metrics with Prometheus
- Docker & Kubernetes : Spinnaker on EKS with Halyard
- Docker & Kubernetes : Continuous Delivery Pipelines with Spinnaker and Kubernetes Engine
- Docker & Kubernetes : Multi-node Local Kubernetes cluster : Kubeadm-dind (docker-in-docker)
- Docker & Kubernetes : Multi-node Local Kubernetes cluster : Kubeadm-kind (k8s-in-docker)
- Docker & Kubernetes : nodeSelector, nodeAffinity, taints/tolerations, pod affinity and anti-affinity - Assigning Pods to Nodes
- Docker & Kubernetes : Jenkins-X on EKS
- Docker & Kubernetes : ArgoCD App of Apps with Heml on Kubernetes
- Docker & Kubernetes : ArgoCD on Kubernetes cluster
- Docker & Kubernetes : GitOps with ArgoCD for Continuous Delivery to Kubernetes clusters (minikube) - guestbook
Ph.D. / Golden Gate Ave, San Francisco / Seoul National Univ / Carnegie Mellon / UC Berkeley / DevOps / Deep Learning / Visualization