ELK - Elasticsearch Indexing Performance
Elastic Search, Logstash, Kibana
Elastic Stack docker/kubernetes series:
Indexing requests are similar to write requests in a traditional database system. If our Elasticsearch workload is write-heavy, it's important to monitor and analyze how effectively we are able to update indices with new information.
When new information is added to an index, or existing information is updated or deleted, each shard in the index is updated via two processes: refresh and flush.
If we are in an indexing (writing)-heavy environment, we may be want to sacrifice some search performance for faster indexing rates. In these scenarios, searches tend to be relatively rare and mostly performed by people from internal organization.
They are willing to wait several seconds for a search, as opposed to a consumer facing a search that must return in milliseconds. So, certain trade-offs can be made that will increase our indexing performance.
Indexing latency:
Elasticsearch does not directly expose this particular metric, but monitoring tools can help us calculate the average indexing latency from the available index_total and index_time_in_millis metrics.
If any increase of the latency, we may be trying to index too many documents at one time (Elasticsearch's documentation recommends starting with a bulk indexing size of 5 to 15 MB and increasing slowly from there).
If we don't need the new information to be immediately available for search, we can optimize for indexing performance over search performance by decreasing refresh frequency until we are done indexing. The index settings API enables us to temporarily disable the refresh interval:
curl -XPUT:9200/ /_settings -d '{ "index" : { "refresh_interval" : "-1" } }'
We can then revert back to the default value of "1s" once we are done indexing.
Flush latency:
Because data is not persisted to disk until a flush is successfully completed, it can be useful to track flush latency and take action if performance begins to take a dive.
If we see this metric increasing steadily, it could indicate a problem with slow disks; this problem may escalate and eventually prevent us from being able to add new information to our index.
We can experiment with lowering the index.translog.flush_threshold_size in the index's flush settings. This setting determines how large the translog size can get before a flush is triggered. However, if we are a write-heavy Elasticsearch user, we should use a tool like iostat to keep an eye on disk IO metrics over time, and consider upgrading our disks if needed.
Tips for testing are as follows:
- Test performance on a single node, with a single shard and no replicas.
- Record performance under 100% default settings so that we have a baseline to measure against.
- Make sure performance tests run for a long time (30+ minutes) so we can evaluate long-term performance, not short-term spikes or latencies. Some events (such as segment merging, and GCs) won't happen right away, so the performance profile can change over time.
- Begin making single changes to the baseline defaults. Test these rigorously, and if performance improvement is acceptable, keep the setting and move on to the next one.
We may want to start using bulk (~10 MB per bulk) indexing requests for optimal performance.
Monitor our nodes with Marvel and/or tools such as iostat, top, and ps to see when resources start to bottleneck.
If we start to receive EsRejectedExecutionException because our cluster can no longer keep up, and at least one resource has reached capacity. Either reduce concurrency, provide more of the limited resource (such as switching from spinning disks to SSDs), or add more nodes.
Elasticsearch heavily uses disks, and the more throughput our disks can handle, the more stable our nodes will be. Here are some tips for optimizing disk I/O:
- Use SSDs.
- Use RAID 0. Striped RAID will increase disk I/O, at the obvious expense of potential failure if a drive dies. Don't use mirrored or parity RAIDS since replicas provide that functionality. Alternatively, use multiple drives and allow Elasticsearch to stripe data across them via multiple path.data directories.
- Do not use remote-mounted storage, such as NFS or SMB/CIFS. The latency introduced here is antithetical to performance.
- On EC2, beware of EBS. Even the SSD-backed EBS options are often slower than local instance storage.
Segment merging is computationally expensive, and can eat up a lot of disk I/O. Merges are scheduled to operate in the background because they can take a long time to finish, especially large segments. This is normally fine, because the rate of large segment merges is relatively rare.
But sometimes merging falls behind the ingestion rate. If this happens, Elasticsearch will automatically throttle indexing requests to a single thread. This prevents a segment explosion problem, in which hundreds of segments are generated before they can be merged. Elasticsearch will log INFO-level messages stating now throttling indexing when it detects merging falling behind indexing.
Elasticsearch defaults here are conservative: we don't want search performance to be impacted by background merging. But sometimes (especially on SSD, or logging scenarios), the throttle limit is too low.
The default is 20 MB/s, which is a good setting for spinning disks. If we have SSDs, we might consider increasing this to 100-200 MB/s.
Elasticsearch runs in the Java Virtual Machine (JVM), which means that JVM garbage collection duration and frequency will be important areas to monitor.
Elasticsearch and Lucene utilize all of the available RAM on our nodes in two ways: JVM heap and the file system cache.
Engineers can resist anything except giving their processes more resources: bigger, better, faster, more of cycles, cores, RAM, disks and interconnects! When these resources are not a bottleneck, this is wasteful but harmless. For processes like Elasticsearch that run on the JVM, the luring temptation is to turn the heap up; what harm could possibly come from having more heap? Alas, the story isn't simple.
JVM Heap size:
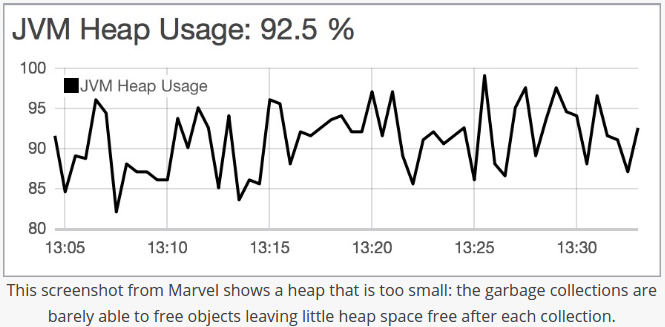
We don't want to set it too big, or too small, in general, Elasticsearch's rule of thumb is allocating less than 50 percent of available RAM to JVM heap, and never going higher than 32 GB.
Garbage collection:
Elasticsearch relies on garbage collection processes to free up heap memory. Because garbage collection uses resources (in order to free up resources),
we should keep an eye on its frequency and duration to see
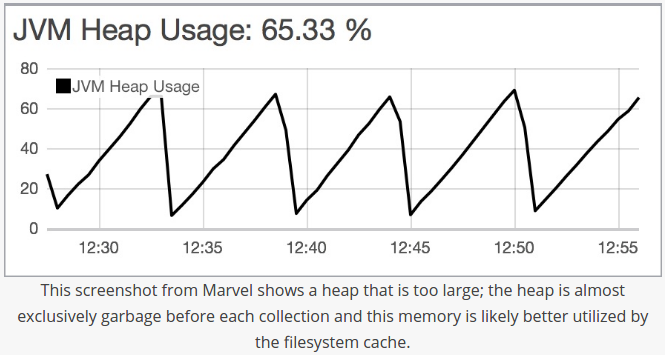
if we need to adjust the heap size. Setting the heap too large can result in long garbage collection times;
these excessive pauses are dangerous because they can lead our cluster to mistakenly register our node as having dropped off the grid.


Picture credit : A Heap of Trouble
- How to monitor Elasticsearch performance
- Indexing Performance Tips
- A Heap of Trouble
- Announcing Rally: Our benchmarking tool for Elasticsearch
Elastic Search, Logstash, Kibana
Elastic Stack docker/kubernetes series:
Ph.D. / Golden Gate Ave, San Francisco / Seoul National Univ / Carnegie Mellon / UC Berkeley / DevOps / Deep Learning / Visualization