Apache Spark 2.0.2 with PySpark : Analyzing Neuroimaging Data with Thunder
In this tutorial, we'll learn more about the function of the brain ( Advancing Innovative Neurotechnologies (BRAIN) Initiative) via PySpark and Thunder tools for the analysis of image and time series data in Python.
We will use these tools for the task of understanding some of the structure of zebrafish brains. We will also cluster different regions of the brain (representing groups of neurons) to discover patterns of activity as the zebrafish behaves over time.
- "Advanced Analytics with Spark" by Sandy Ryza, Uri Laserson, Sean Owen, and Josh Wills
- http://docs.thunder-project.org
When PySpark's Python interpreter starts, it also starts a JVM with which it communicates through a socket. PySpark uses the Py4J project to handle this communication. The JVM functions as the actual Spark driver, and loads a JavaSparkContext that communicates with the Spark executors across the cluster.
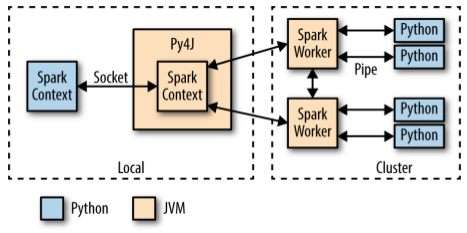
Python API calls to the SparkContext object are then translated into Java API calls to the JavaSparkContext. For example, the implementation of PySparks sc.textFile() dispatches a call to the .textFile() method of the JavaSparkContext, which ultimately communicates with the Spark executor JVMs to load the text data from HDFS.
The Spark executors on the cluster start a Python interpreter for each core, with which they communicate data through a pipe when they need to execute user code.
A Python RDD in the local PySpark client corresponds to a PythonRDD object in the local JVM. The data associated with the RDD actually lives in the Spark JVMs as Java objects. For example, running sc.textFile() in the Python interpreter will call the JavaSparkContext's textFile() method, which loads the data as Java String objects in the cluster. Similarly, loading a Parquet/Avro file using newAPIHadoopFile will load the objects as Java Avro objects.
When an API call is made on the Python RDD, any associated code (e.g., Python lambda function) is serialized via "cloudpickle (a custom module built by the now defunct PiCloud)" and distributed to the executors. The data is then converted from Java objects to a Python-compatible representation (e.g., pickle objects) and streamed to executor-associated Python interpreters through a pipe.
Any necessary Python processing is executed in the interpreter, and the resulting data is stored back as an RDD (as pickle objects by default) in the JVMs.
Thunder requires Spark, as well as the Python libraries NumPy, SciPy, matplotlib, and scikit-learn.
Thunder is a Python tool set for processing large amounts of spatial/temporal data sets (i.e., large multidimensional matrices) on Spark. It heavily uses NumPy for matrix computations and also the MLlib library for distributed implementations of some statistical techniques.
In the following section, we introduce the Thunder API, and attempt to classify some neural traces into a set of patterns using MLlib's K-means implementation as wrapped by Thunder and PySpark.
Since we have Spark installed, we can install Thunder just by calling pip install thunder-python on both the master node and all worker nodes of our cluster.
$ sudo pip install thunder-python
...
Downloading thunder-python-1.4.2.tar.gz
...
We may want to other utilities:
$ sudo pip install showit
The showit does really simple image display with matplotlib. Just shows images. No axes, no interpolation, no frills.
Thunder is an ecosystem of tools for the analysis of image and time series data in Python.
It provides data structures and algorithms for loading, processing, and analyzing these data, and can be useful in a variety of domains, including neuroscience, medical imaging, video processing, and geospatial and climate analysis.
It can be used locally, but also supports large-scale analysis through the distributed computing engine spark.
All data structures and analyses in Thunder are designed to run identically and with the same API whether local or distributed.
- from https://github.com/thunder-project/thunder
Here's a short snippet showing how to load an image sequence (in this case random data), median filter it, transform it to a series, detrend and compute a fourier transform on each pixel, then convert it to an array:
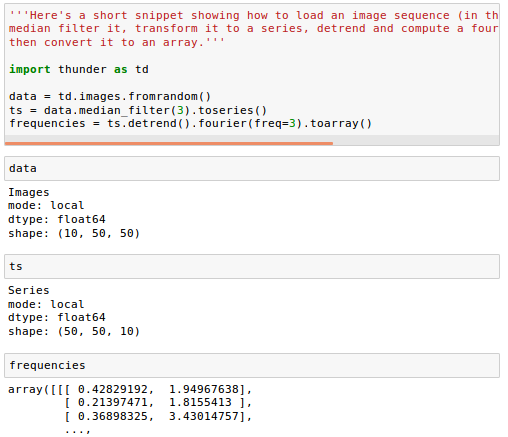
An Images object is a collection of either 2D images or 3D volumes. Under the hood, it wraps an n-dimensional array, and supports either distributed operations via Spark or local operations via numpy, with an identical API. It supports several simple manipulations of image content, exporting image data, and conversion to other formats.
Once we have Spark running and Thunder installed, using them together is easy. All the loading methods in Thunder take an optional argument engine, which can be passed a SparkContext. This is automatically created as the variable sc when we start Spark from the executable pyspark.

When we have this sc variable, we can just pass it as an argument to a data loading method. For example, let's create some random image data in Thunder.
First, we'll do it LOCALLY:

If we instead provide a SparkContext as the variable sc, we get the same data in DISTRIBUTED (or Spark) mode:

Let's load our actual sample images data. It can be loaded using the td.images.from* methods, which support loading from a few different formats:
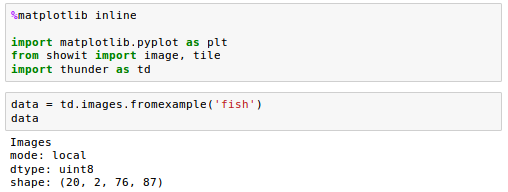
These are 20 3d volumes, each one with shape (2, 76, 87). Let's look at the first volume:
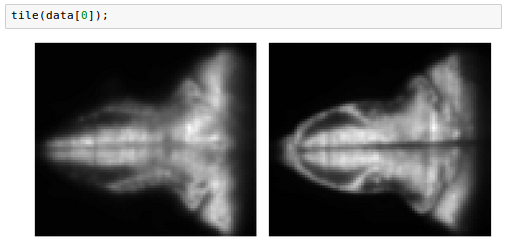
Note that, although data is not itself an array, we can index into it using bracket notation, and pass it as input to plotting methods that expect arrays, because it will be automatically converted.
An Images object has a variety of methods for manipulation, all of which are automatically parallelized across images if running on a cluster.
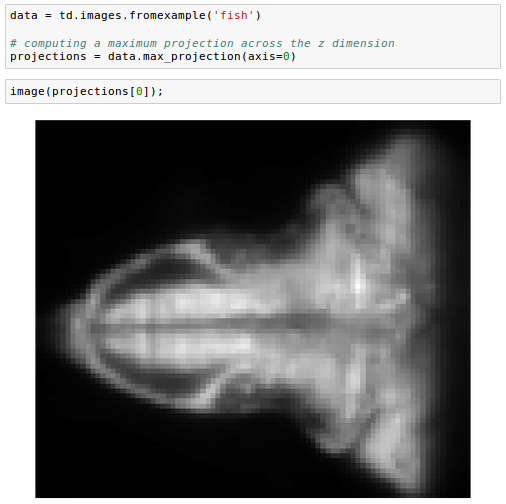
One common manipulation on volumetric data is computing a maximum projection across the z dimension:
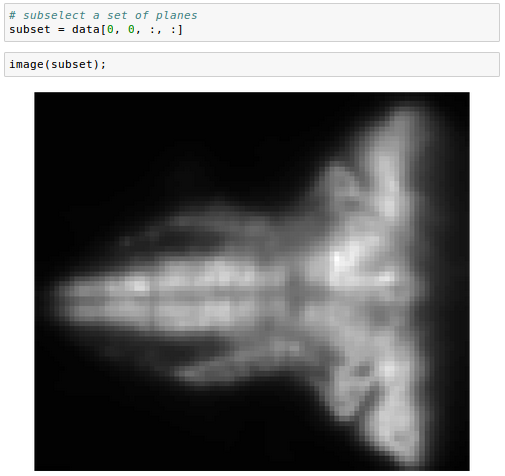
We can also subselect a set of planes, specifying the top and bottom of the desired range:
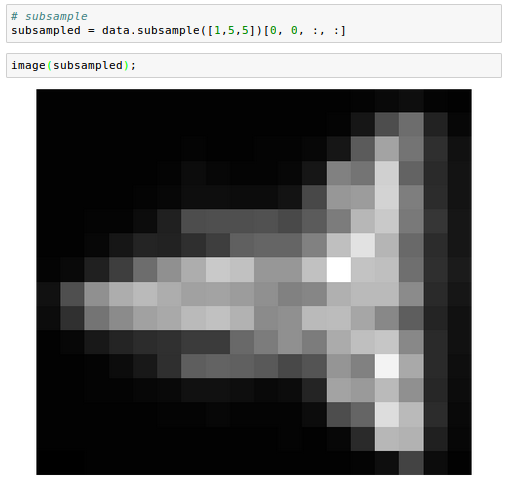
And we can subsample in space:
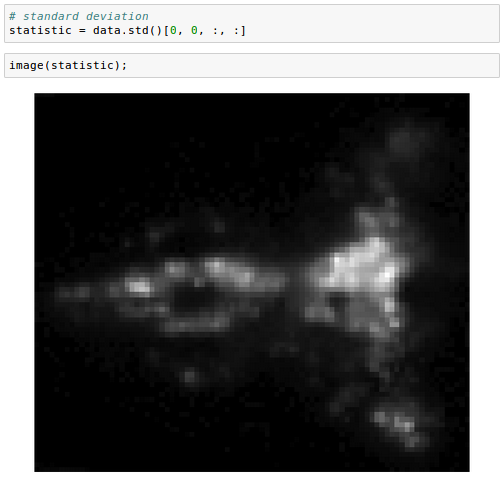
We can also perform operations that aggregate across images. For example, computing the standard deviation:
We commonly encounter images or volumes that vary over time, e.g. from a movie. It can be useful to convert these data into a Series object: another wrapper for n-dimensional arrays designed to work with collections of one-dimensional indexed records, often time series.
Here we load our image data and convert to series:

Let's check properties of the Series to make sure the conversion makes sense. We have twenty images, so there should be twenty time points:

The shape should be the original pixel dimensions (2, 76, 87) and the time dimension (20):

This conversion from images to series is essentially a transpose, but in the distributed setting it uses an efficient blocked representation.
If we want to collapse the pixel dimensions, we can use flatten:

We can also look at some example time series, after filtering on standard deviation and normalizing:
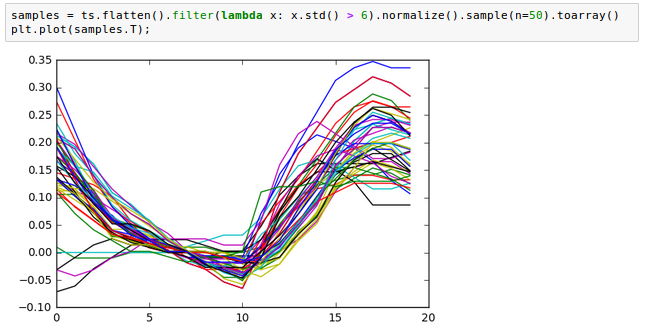
We'll work with saved tif-images from https://github.com/thunder-project/thunder/tree/v0.4.1/python/thunder/utils/data/fish/tif-stack.
$ ls /home/k/TEST/PySpark/images
time001.tif  time004.tif  time007.tif  time010.tif  time013.tif  time016.tif  time019.tif
time002.tif  time005.tif  time008.tif  time011.tif  time014.tif  time017.tif  time020.tif
time003.tif  time006.tif  time009.tif  time012.tif  time015.tif  time018.tif
The steps of loading and manipulation images are the same as we've done in the previous sections. We can just specify the path:
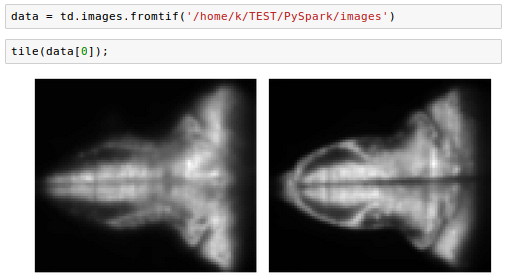
Creating Thunder Spark Context (tsc) was not successful from Jupyter for the functions uch as fromtif() or fromexample().
Code in Jupyter notebook is available (PySpark-Thunder.ipynb) from PySpark
Ph.D. / Golden Gate Ave, San Francisco / Seoul National Univ / Carnegie Mellon / UC Berkeley / DevOps / Deep Learning / Visualization