Docker & Kubernetes : Deploy Prometheus and Grafana using kube-prometheus-stack Helm Chart
Since its intruction in 2016 by CoreOS, the operators are rapidly becoming the standard way of managing applications on Kubernetes especially the ones which are stateful in nature.
Whenever we deploy our application on Kubernetes cluster, we leverage multiple Kubernetes objects such as deployment, service, role, config map, ingress, etc. However, as our application gets complex, managing our application only with the native Kubernetes objects becomes difficult.
While Kubernetes manages a complete lifecycle of stateless application, it cannot manage (automate) the lifecycle of stateless application.
Combined with CRDs (custom resource definitions) and custom controllers, operators eliminate the requirement for manual intervention while performing such tasks as upgrading, handling failure recovery, and scaling stateful applications.
In summary, by using operators, we can simplify and standardize the management of complex applications and stateful workloads within our Kubernetes cluster. This approach aligns with the principles of GitOps and declarative infrastructure, which aim to specify the desired state of our infrastructure and applications as code.
Note: The stable/prometheus-operator Helm chart has been deprecated because it is no longer maintained by the Prometheus Operator team. Development of the Prometheus Operator has moved to the prometheus-community/helm-charts repository, and the chart has been renamed to kube-prometheus-stack to more accurately reflect that it installs the entire kube-prometheus stack, not just the Prometheus Operator.
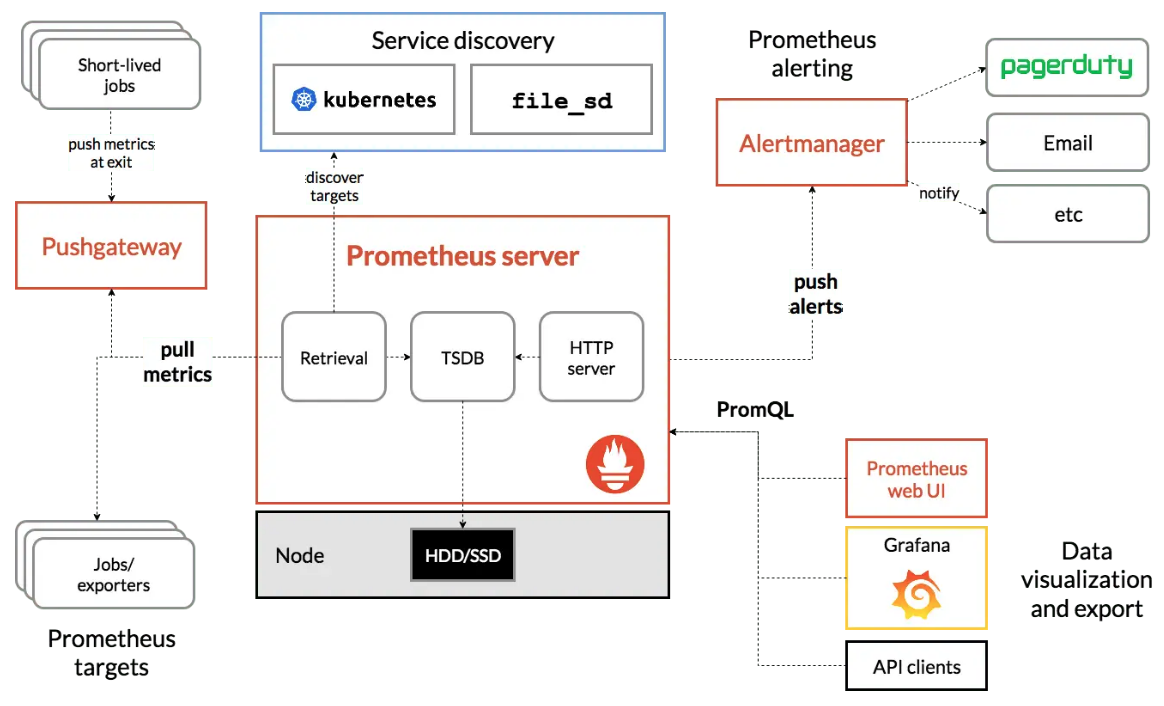
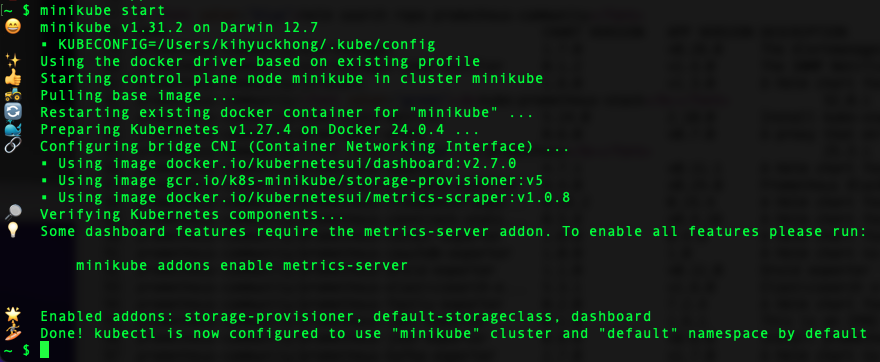
We'll deploy Prometheus and Grafana on minikube using helm:
$ helm version
version.BuildInfo{Version:"v3.5.3", GitCommit:"041ce5a2c17a58be0fcd5f5e16fb3e7e95fea622", GitTreeState:"dirty", GoVersion:"go1.16.2"}

$ helm repo list
NAME                	URL
stable              	https://charts.helm.sh/stable
bitnami             	https://charts.bitnami.com/bitnami
argo-cd             	https://argoproj.github.io/argo-helm
prometheus-community	https://prometheus-community.github.io/helm-charts
hashicorp           	https://helm.releases.hashicorp.com
eks                 	https://aws.github.io/eks-charts
jenkinsci           	https://charts.jenkins.io

$ helm search repo prometheus-community
NAME                                              	CHART VERSION	APP VERSION	DESCRIPTION
prometheus-community/alertmanager                 	1.7.0        	v0.26.0    	The Alertmanager handles alerts sent by client ...
prometheus-community/alertmanager-snmp-notifier   	0.1.2        	v1.4.0     	The SNMP Notifier handles alerts coming from Pr...
prometheus-community/jiralert                     	1.6.0        	v1.3.0     	A Helm chart for Kubernetes to install jiralert
prometheus-community/kube-prometheus-stack        	52.0.1       	v0.68.0    	kube-prometheus-stack collects Kubernetes manif...
prometheus-community/kube-state-metrics           	5.14.0       	2.10.0     	Install kube-state-metrics to generate and expo...
prometheus-community/prom-label-proxy             	0.6.0        	v0.7.0     	A proxy that enforces a given label in a given ...
prometheus-community/prometheus                   	25.3.1       	v2.47.0    	Prometheus is a monitoring system and time seri...
prometheus-community/prometheus-adapter           	4.7.1        	v0.11.1    	A Helm chart for k8s prometheus adapter
prometheus-community/prometheus-blackbox-exporter 	8.4.0        	v0.24.0    	Prometheus Blackbox Exporter
prometheus-community/prometheus-cloudwatch-expo...	0.25.2       	0.15.4     	A Helm chart for prometheus cloudwatch-exporter
prometheus-community/prometheus-conntrack-stats...	0.5.8        	v0.4.16    	A Helm chart for conntrack-stats-exporter
prometheus-community/prometheus-consul-exporter   	1.0.0        	0.4.0      	A Helm chart for the Prometheus Consul Exporter
prometheus-community/prometheus-couchdb-exporter  	1.0.0        	1.0        	A Helm chart to export the metrics from couchdb...
prometheus-community/prometheus-druid-exporter    	1.1.0        	v0.11.0    	Druid exporter to monitor druid metrics with Pr...
prometheus-community/prometheus-elasticsearch-e...	5.3.1        	v1.6.0     	Elasticsearch stats exporter for Prometheus
prometheus-community/prometheus-fastly-exporter   	0.2.0        	7.2.4      	A Helm chart for the Prometheus Fastly Exporter
prometheus-community/prometheus-ipmi-exporter     	0.1.0        	1.6.1      	This is an IPMI exporter for Prometheus.
prometheus-community/prometheus-json-exporter     	0.8.0        	v0.6.0     	Install prometheus-json-exporter
prometheus-community/prometheus-kafka-exporter    	2.7.0        	v1.7.0     	A Helm chart to export the metrics from Kafka i...
prometheus-community/prometheus-memcached-exporter	0.1.0        	v0.13.0    	Prometheus exporter for Memcached metrics
prometheus-community/prometheus-modbus-exporter   	0.1.0        	0.4.0      	A Helm chart for prometheus-modbus-exporter
prometheus-community/prometheus-mongodb-exporter  	3.4.0        	0.39.0     	A Prometheus exporter for MongoDB metrics
prometheus-community/prometheus-mysql-exporter    	2.1.0        	v0.15.0    	A Helm chart for prometheus mysql exporter with...
prometheus-community/prometheus-nats-exporter     	2.13.0       	0.12.0     	A Helm chart for prometheus-nats-exporter
prometheus-community/prometheus-nginx-exporter    	0.2.0        	0.11.0     	A Helm chart for the Prometheus NGINX Exporter
prometheus-community/prometheus-node-exporter     	4.23.2       	1.6.1      	A Helm chart for prometheus node-exporter
prometheus-community/prometheus-operator          	9.3.2        	0.38.1     	DEPRECATED - This chart will be renamed. See ht...
prometheus-community/prometheus-operator-admiss...	0.7.0        	0.68.0     	Prometheus Operator Admission Webhook
prometheus-community/prometheus-operator-crds     	6.0.0        	v0.68.0    	A Helm chart that collects custom resource defi...
prometheus-community/prometheus-pgbouncer-exporter	0.1.1        	1.18.0     	A Helm chart for prometheus pgbouncer-exporter
prometheus-community/prometheus-pingdom-exporter  	2.5.0        	20190610-1 	A Helm chart for Prometheus Pingdom Exporter
prometheus-community/prometheus-pingmesh-exporter 	0.3.0        	v1.1.0     	Prometheus Pingmesh Exporter
prometheus-community/prometheus-postgres-exporter 	5.1.0        	v0.14.0    	A Helm chart for prometheus postgres-exporter
prometheus-community/prometheus-pushgateway       	2.4.1        	v1.6.1     	A Helm chart for prometheus pushgateway
prometheus-community/prometheus-rabbitmq-exporter 	1.9.0        	v0.29.0    	Rabbitmq metrics exporter for prometheus
prometheus-community/prometheus-redis-exporter    	6.0.1        	v1.55.0    	Prometheus exporter for Redis metrics
prometheus-community/prometheus-smartctl-exporter 	0.7.0        	v0.11.0    	A Helm chart for Kubernetes
prometheus-community/prometheus-snmp-exporter     	1.8.1        	v0.21.0    	Prometheus SNMP Exporter
prometheus-community/prometheus-stackdriver-exp...	4.3.1        	0.13.0     	Stackdriver exporter for Prometheus
prometheus-community/prometheus-statsd-exporter   	0.10.1       	v0.24.0    	A Helm chart for prometheus stats-exporter
prometheus-community/prometheus-to-sd             	0.4.2        	0.5.2      	Scrape metrics stored in prometheus format and ...
prometheus-community/prometheus-windows-exporter  	0.1.1        	0.22.0     	A Helm chart for prometheus windows-exporter
The main difference between prometheus-community/kube-prometheus-stack and prometheus-community/prometheus is that the former is a complete monitoring stack for Kubernetes clusters, while the latter is just the Prometheus monitoring server.
The kube-prometheus-stack chart includes the following components:
- Prometheus: A monitoring server that collects and stores metrics from monitored targets.
- Alertmanager: An alerting system that routes alerts to notification channels.
- Grafana: A data visualization and monitoring dashboard.
- Prometheus Operator: A Kubernetes operator that automates the deployment and management of Prometheus, Alertmanager, and Grafana.
The prometheus chart just includes the Prometheus monitoring server. Users can choose to deploy Alertmanager, Grafana, and other components separately.
Here is a table that summarizes the key differences between the two charts:

Which chart we choose will depend on our specific needs. If we are looking for a complete monitoring stack for Kubernetes clusters, then the kube-prometheus-stack chart is a good option. If we just need the Prometheus monitoring server, then the prometheus chart is a good option.
Here are some additional benefits of using the kube-prometheus-stack chart:
- It is easy to install and configure.
- It is actively maintained by the Prometheus Operator team.
- It includes the latest versions of Prometheus, Alertmanager, and Grafana.
- It supports all of the features of the kube-prometheus stack, including Prometheus, Alertmanager, and Grafana.
Use the helm install command to install the kube-prometheus-stack chart. We can provide a release name (e.g., monitoring-stack)
and set configuration values. Here's an example installation command:
$ helm install monitoring-stack prometheus-community/kube-prometheus-stack
NAME: monitoring-stack
LAST DEPLOYED: Thu Oct 26 09:09:29 2023
NAMESPACE: default
STATUS: deployed
REVISION: 1
NOTES:
kube-prometheus-stack has been installed. Check its status by running:
  kubectl --namespace default get pods -l "release=monitoring-stack"

$ kubectl --namespace default get pods -l "release=monitoring-stack"
NAME                                                  READY   STATUS    RESTARTS   AGE
monitoring-stack-kube-prom-operator-bc9dcb48d-8kvg2   1/1     Running   0          2m44s
monitoring-stack-kube-state-metrics-d4d55dbd4-x2dk5   1/1     Running   0          2m44s
monitoring-stack-prometheus-node-exporter-8bn6h       1/1     Running   0          2m44s

$ helm list
NAME            	NAMESPACE	REVISION	UPDATED                             	STATUS  	CHART                       	APP VERSION
monitoring-stack	default  	1       	2023-10-25 20:26:19.197809 -0700 PDT	deployed	kube-prometheus-stack-52.0.1	v0.68.0


$ kubectl get all
NAME                                                         READY   STATUS    RESTARTS   AGE
pod/alertmanager-monitoring-stack-kube-prom-alertmanager-0   2/2     Running   0          3m21s
pod/monitoring-stack-grafana-674bf9c959-xlkth                3/3     Running   0          3m52s
pod/monitoring-stack-kube-prom-operator-bc9dcb48d-8kvg2      1/1     Running   0          3m52s
pod/monitoring-stack-kube-state-metrics-d4d55dbd4-x2dk5      1/1     Running   0          3m52s
pod/monitoring-stack-prometheus-node-exporter-8bn6h          1/1     Running   0          3m52s
pod/prometheus-monitoring-stack-kube-prom-prometheus-0       2/2     Running   0          3m18s

NAME                                                TYPE        CLUSTER-IP       EXTERNAL-IP   PORT(S)                      AGE
service/alertmanager-operated                       ClusterIP   None             <none>         9093/TCP,9094/TCP,9094/UDP   3m26s
service/kubernetes                                  ClusterIP   10.96.0.1        <none>         443/TCP                      14d
service/monitoring-stack-grafana                    ClusterIP   10.97.180.91     <none>         80/TCP                       3m57s
service/monitoring-stack-kube-prom-alertmanager     ClusterIP   10.99.182.242    <none>         9093/TCP,8080/TCP            3m57s
service/monitoring-stack-kube-prom-operator         ClusterIP   10.105.250.92    <none>         443/TCP                      3m57s
service/monitoring-stack-kube-prom-prometheus       ClusterIP   10.105.7.102     <none>         9090/TCP,8080/TCP            3m57s
service/monitoring-stack-kube-state-metrics         ClusterIP   10.103.128.112   <none>         8080/TCP                     3m57s
service/monitoring-stack-prometheus-node-exporter   ClusterIP   10.98.203.1      <none>         9100/TCP                     3m57s
service/prometheus-operated                         ClusterIP   None             <none>         9090/TCP                     3m22s

NAME                                                       DESIRED   CURRENT   READY   UP-TO-DATE   AVAILABLE   NODE SELECTOR            AGE
daemonset.apps/monitoring-stack-prometheus-node-exporter   1         1         1       1            1           kubernetes.io/os=linux   3m56s

NAME                                                  READY   UP-TO-DATE   AVAILABLE   AGE
deployment.apps/monitoring-stack-grafana              1/1     1            1           3m56s
deployment.apps/monitoring-stack-kube-prom-operator   1/1     1            1           3m56s
deployment.apps/monitoring-stack-kube-state-metrics   1/1     1            1           3m56s

NAME                                                            DESIRED   CURRENT   READY   AGE
replicaset.apps/monitoring-stack-grafana-674bf9c959             1         1         1       3m56s
replicaset.apps/monitoring-stack-kube-prom-operator-bc9dcb48d   1         1         1       3m56s
replicaset.apps/monitoring-stack-kube-state-metrics-d4d55dbd4   1         1         1       3m56s

NAME                                                                    READY   AGE
statefulset.apps/alertmanager-monitoring-stack-kube-prom-alertmanager   1/1     3m26s
Prometheus is exposed via a ClusterIP service, which means it's not directly accessible from outside the Kubernetes cluster.
To access the Prometheus UI, we have a few options:
1. Port Forwarding (Temporary Access):
$ kubectl port-forward svc/monitoring-stack-kube-prom-prometheus 9090:9090
Forwarding from 127.0.0.1:9090 -> 9090
Forwarding from [::1]:9090 -> 9090
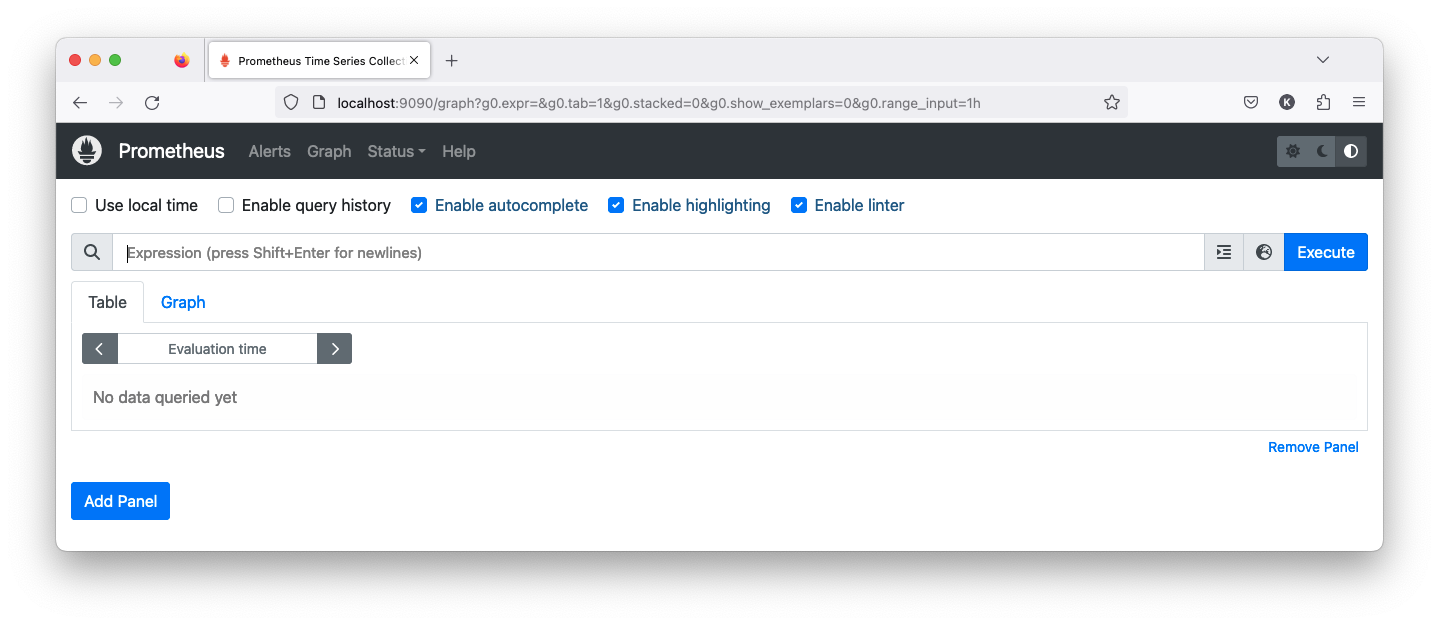
Prometheus UI:
2. Expose Prometheus Service (Longer-Term Access) by changing its service type to either NodePort or LoadBalancer:
$ kubectl expose service monitoring-stack-kube-prom-prometheus \
--type=NodePort --target-port=9090 --name=prometheus-server-nodeport
service/prometheus-server-nodeport exposed

$ minikube service prometheus-server-nodeport --url
http://127.0.0.1:54789
http://127.0.0.1:54790
❗  Because you are using a Docker driver on darwin, the terminal needs to be open to run it.
The minikube service command is used to open a service running inside our Minikube cluster and retrieve its URL,
making it accessible from our local machine. So, when we run the command, Minikube will determine the NodePort assigned to the service,
open a local connection to it, and provide us with the full URL that we can use to access the service from our local machine.
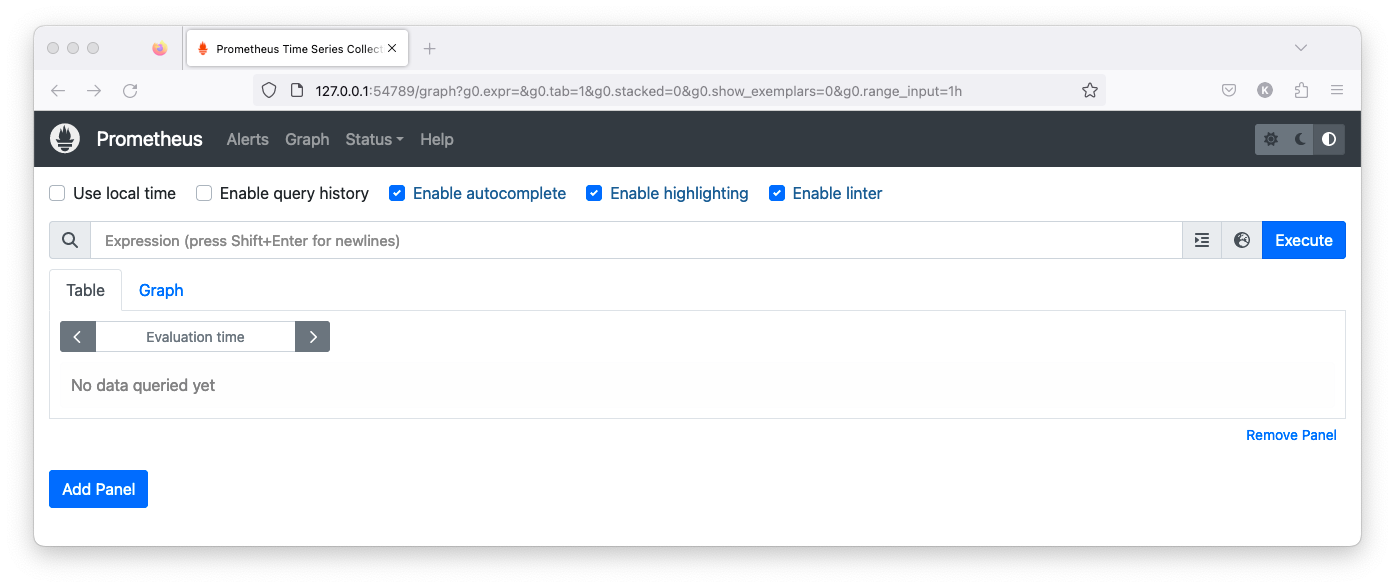
Prometheus UI via NodePort:
3. Ingress or External Load Balancer (Recommended for Production).
Here, we will choose option #1 which is port forwarding to temporarily access the Prometheus UI from our local machine:
Expose Grafana service via NodePort in order to access Grafana UI:
$ kubectl get svc
NAME                                        TYPE        CLUSTER-IP       EXTERNAL-IP   PORT(S)                         AGE
...
monitoring-stack-grafana                    ClusterIP   10.97.180.91     <none>        80/TCP                          40m
...

$ kubectl port-forward svc/monitoring-stack-grafana 8888:80
Forwarding from 127.0.0.1:8888 -> 3000
Forwarding from [::1]:8888 -> 3000
Note that we used kubectl port-forward and specified svc/monitoring-stack-grafana service resource we want to access.
This Service is used to expose Grafana, a monitoring and observability platform, to the network.
8888:80 specifies the port forwarding which means that we want to forward traffic from port 8888 on our local machine to port 80 on the "monitoring-stack-grafana" Service.
We need to get Grafana admin user and the credential:
$ kubectl get secret --namespace default monitoring-stack-grafana -o jsonpath="{.data.admin-user}" | base64 --decode ; echo
admin

$ kubectl get secret --namespace default monitoring-stack-grafana -o jsonpath="{.data.admin-password}" | base64 --decode ; echo
prom-operator
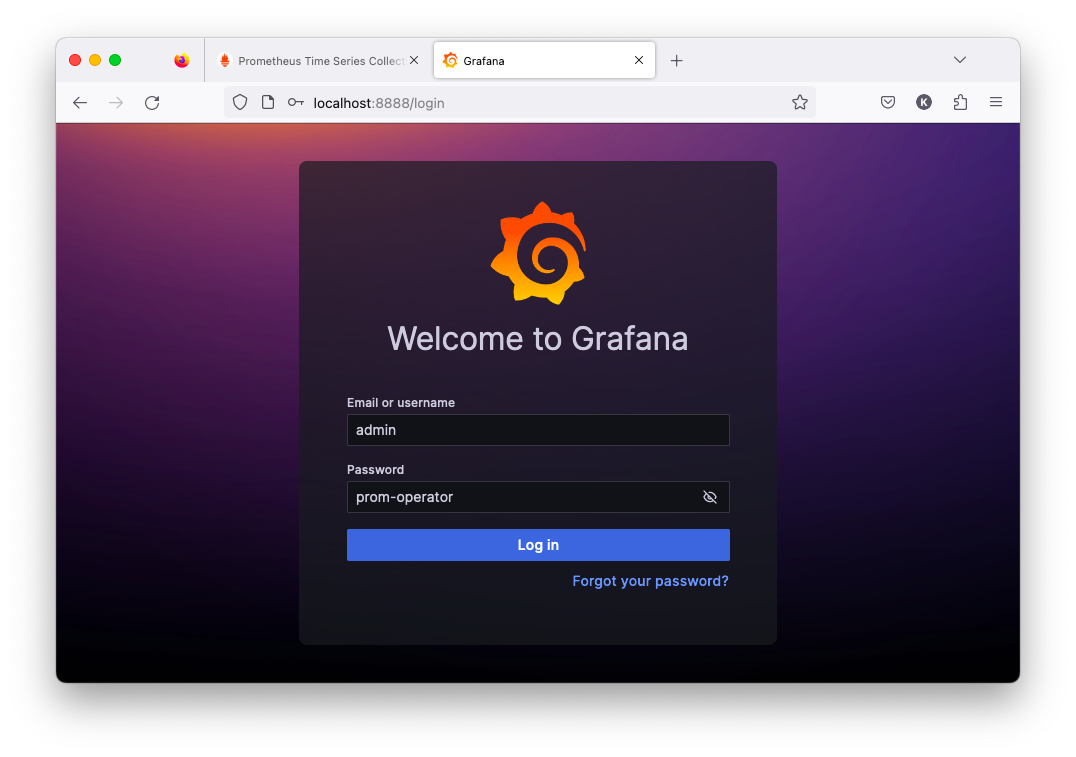
Access the Grafana UI via http://localhost:8888 and enter 'admin' credentials:
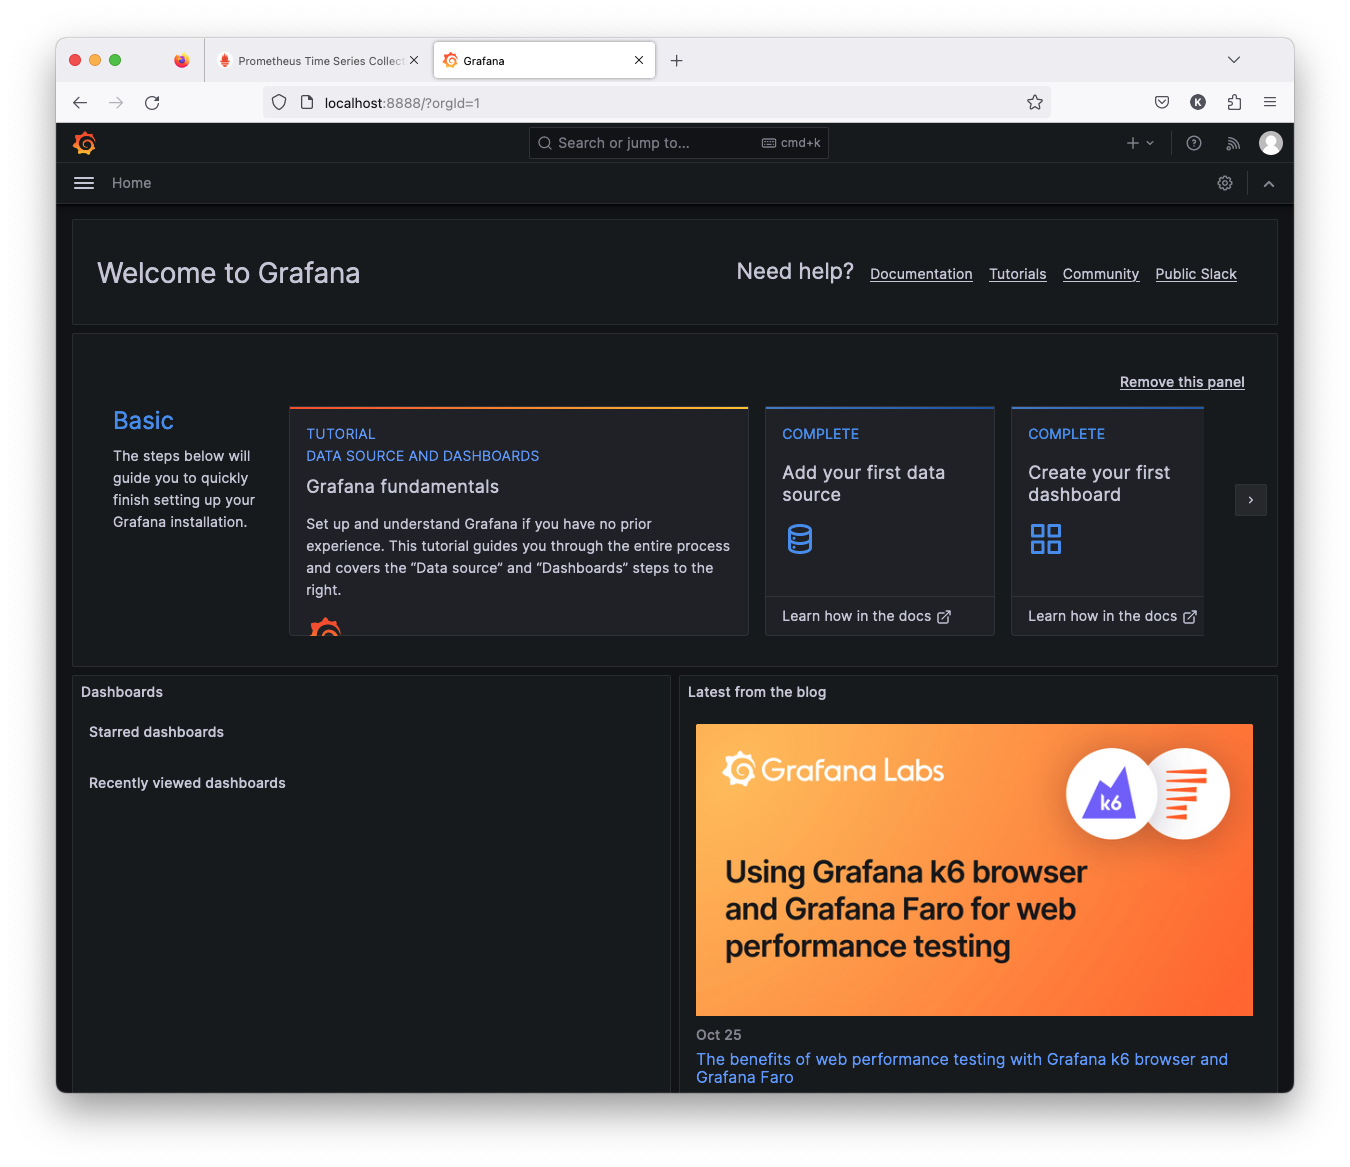
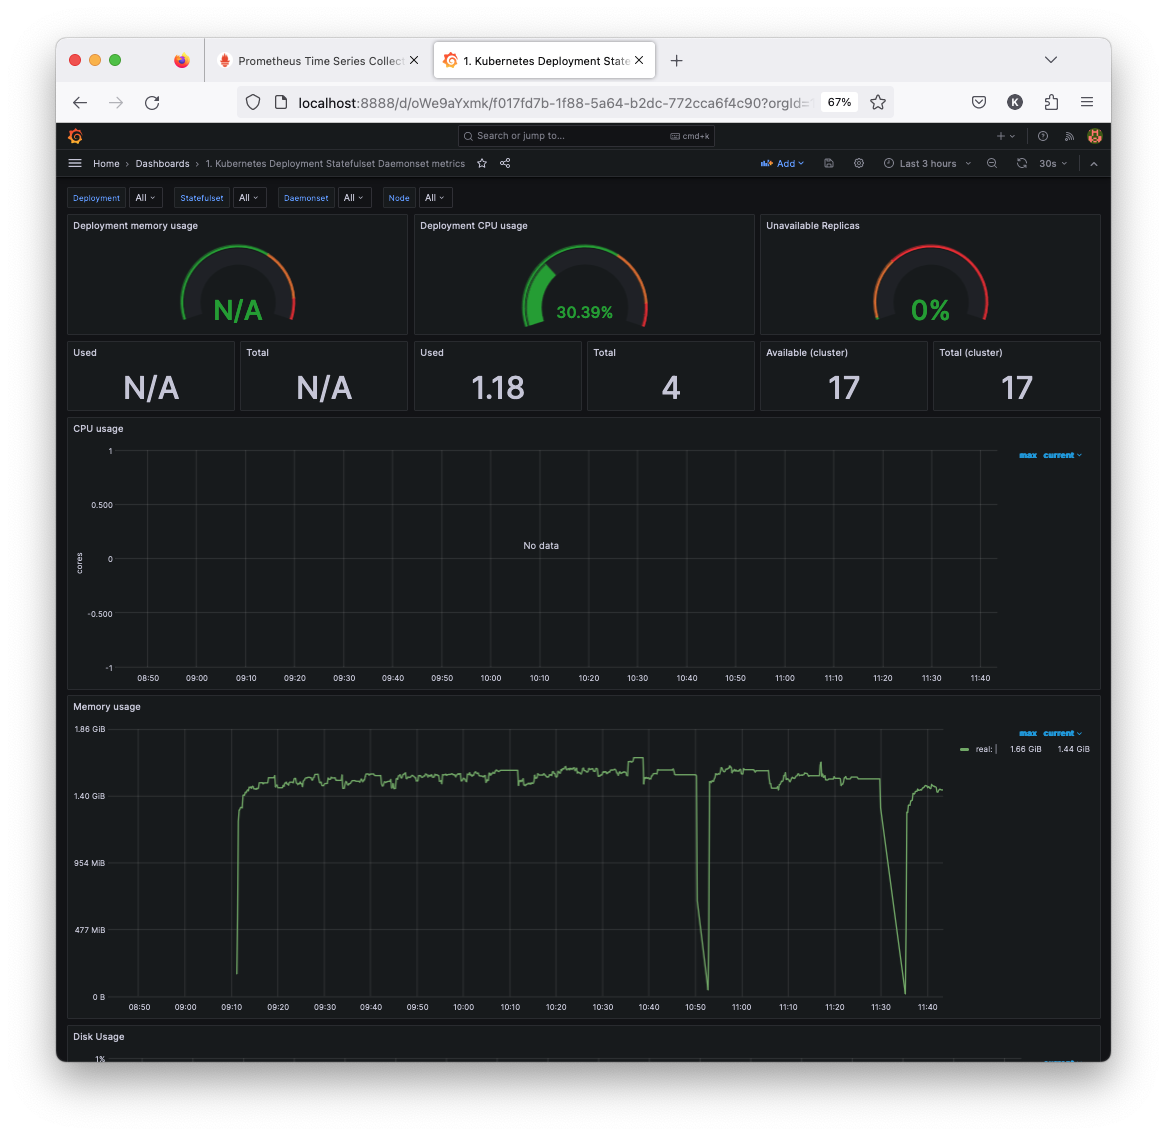
Let's create a Kubernetes dashboard from the Grafana template which enables us to monitor Kubernetes deployments in cluster using Prometheus and the dashboard shows overall cluster CPU / Memory of deployments, replicas in each deployment.
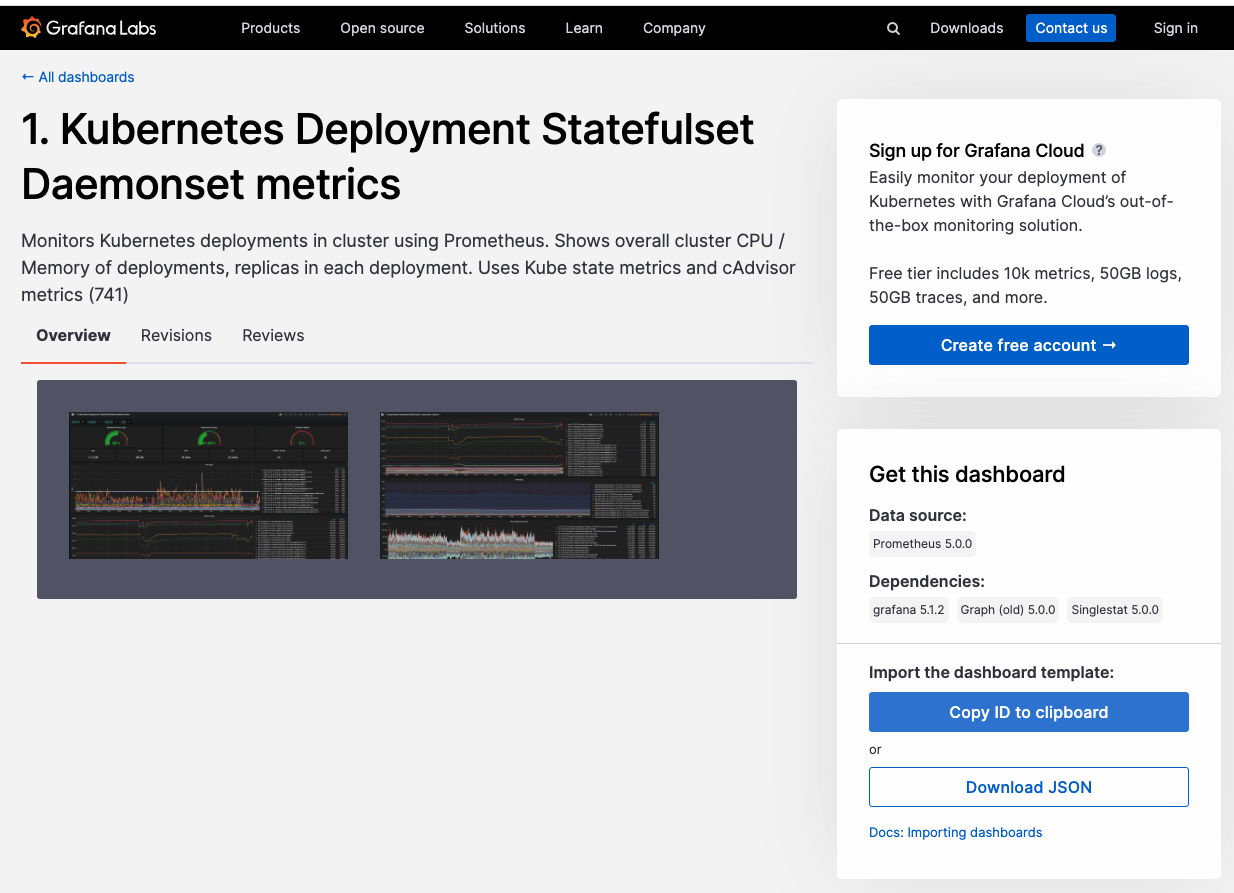
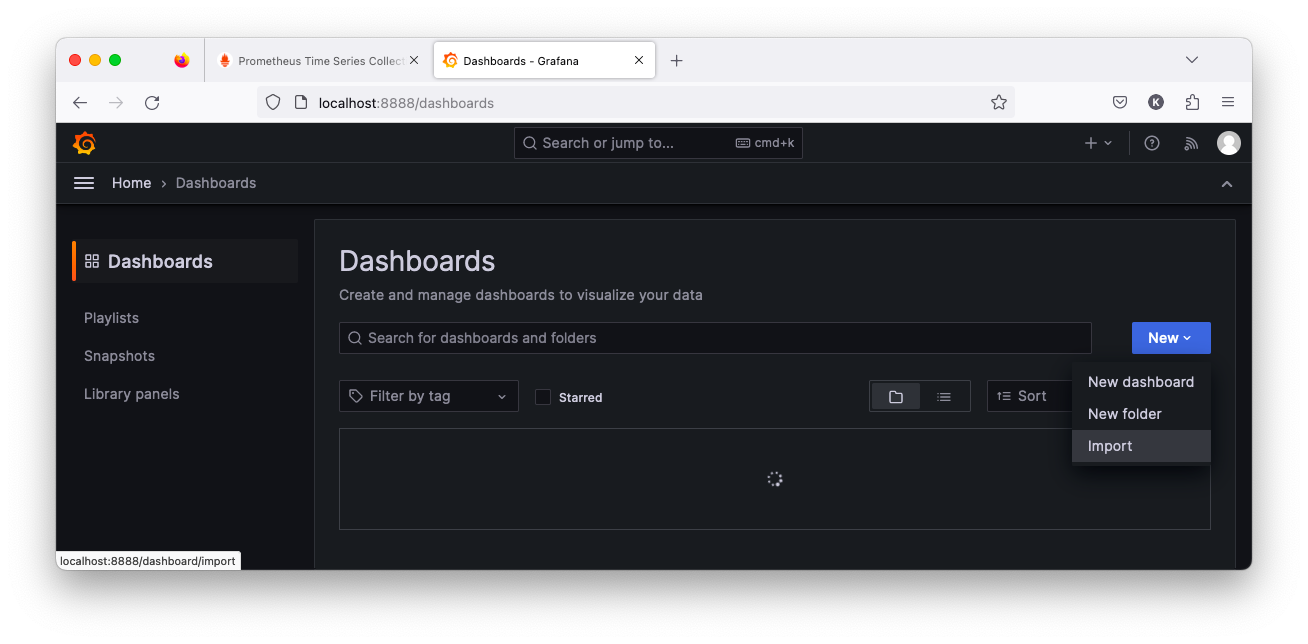
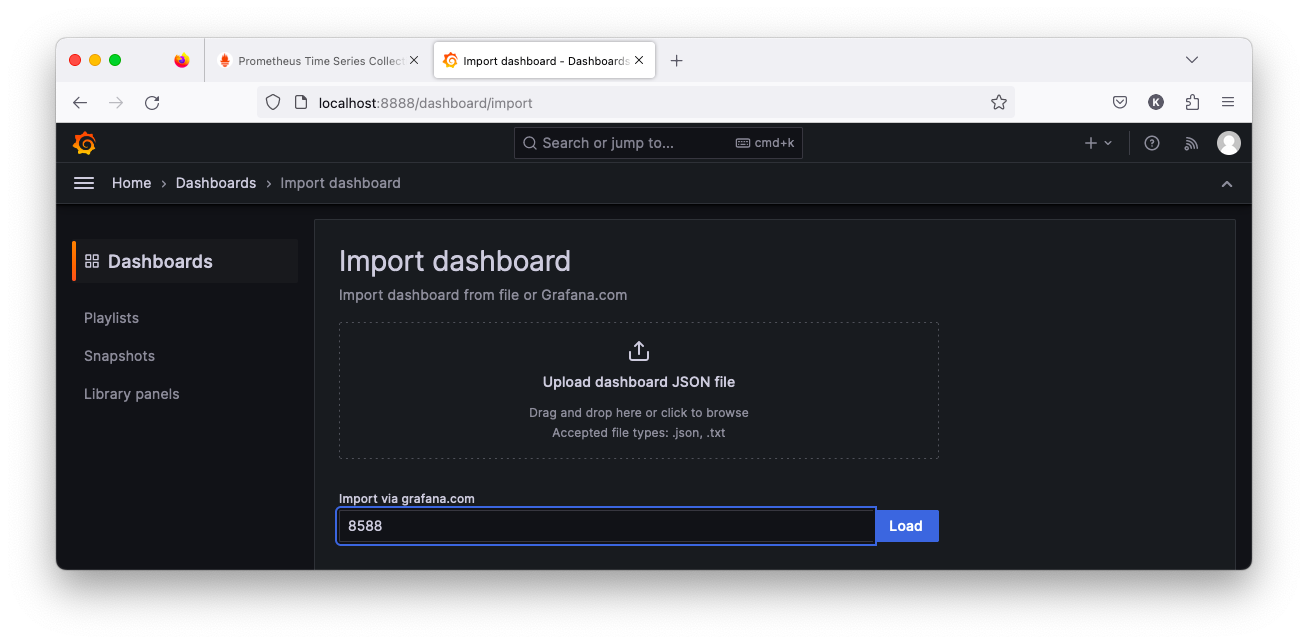
Click "Load". Then Grafana will automatically fetch the template from the Grafana website:
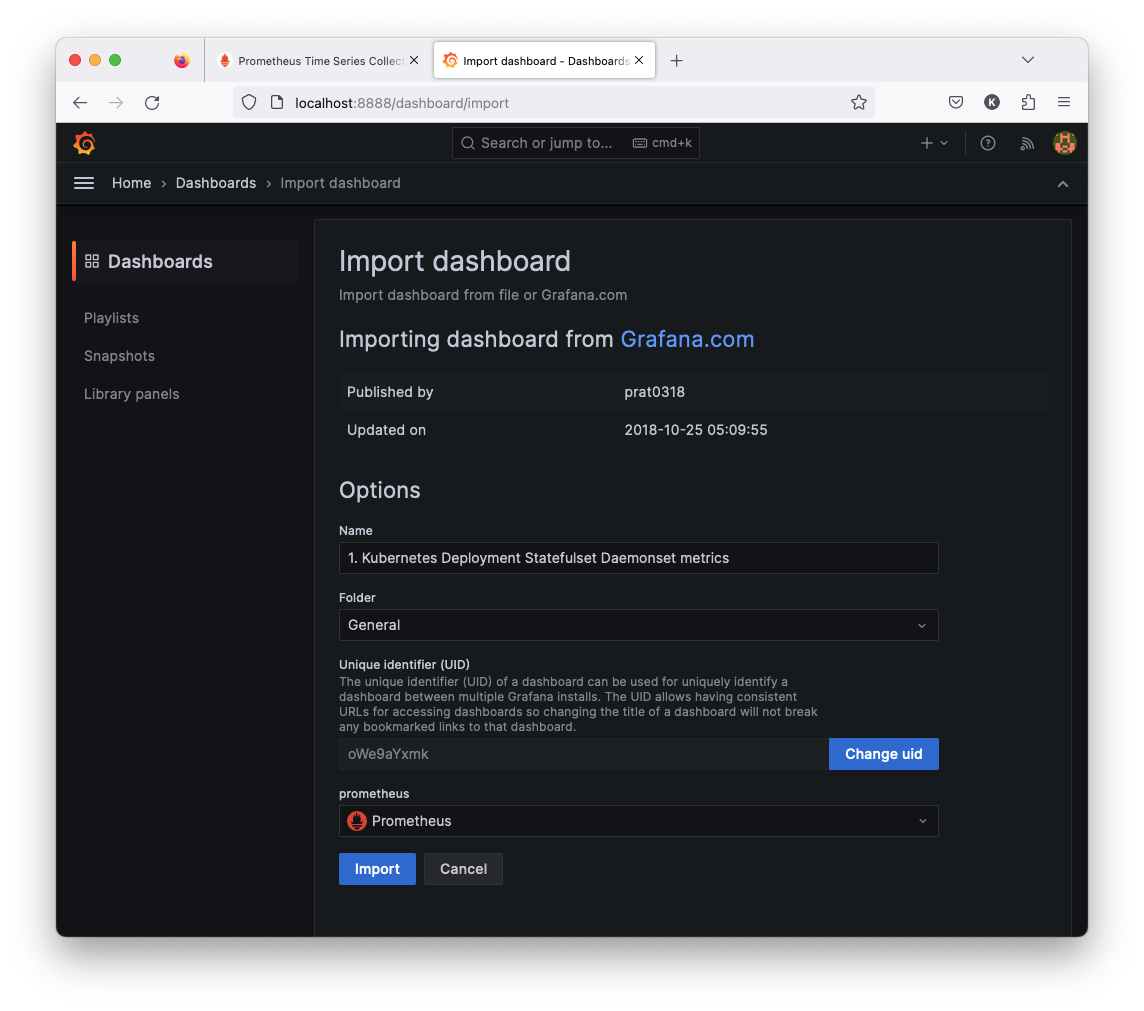
Now we see the imported Kubernetes dashboard:
Recall, we did helm install to deploy our Prometheus stack:
$ helm install monitoring-stack prometheus-community/kube-prometheus-stack

$ helm ls
NAME            	NAMESPACE	REVISION	UPDATED                             	STATUS  	CHART                       	APP VERSION
monitoring-stack	default  	1       	2023-10-26 09:09:29.383187 -0700 PDT	deployed	kube-prometheus-stack-52.0.1	v0.68.0
To undo the deploy, we may want to use helm delete with the release name:
$ helm delete monitoring-stack
release "monitoring-stack" uninstalled

$ kubectl get all
NAME                 TYPE        CLUSTER-IP   EXTERNAL-IP   PORT(S)   AGE
service/kubernetes   ClusterIP   10.96.0.1    <none>        443/TCP   15d
Docker & K8s
- Docker install on Amazon Linux AMI
- Docker install on EC2 Ubuntu 14.04
- Docker container vs Virtual Machine
- Docker install on Ubuntu 14.04
- Docker Hello World Application
- Nginx image - share/copy files, Dockerfile
- Working with Docker images : brief introduction
- Docker image and container via docker commands (search, pull, run, ps, restart, attach, and rm)
- More on docker run command (docker run -it, docker run --rm, etc.)
- Docker Networks - Bridge Driver Network
- Docker Persistent Storage
- File sharing between host and container (docker run -d -p -v)
- Linking containers and volume for datastore
- Dockerfile - Build Docker images automatically I - FROM, MAINTAINER, and build context
- Dockerfile - Build Docker images automatically II - revisiting FROM, MAINTAINER, build context, and caching
- Dockerfile - Build Docker images automatically III - RUN
- Dockerfile - Build Docker images automatically IV - CMD
- Dockerfile - Build Docker images automatically V - WORKDIR, ENV, ADD, and ENTRYPOINT
- Docker - Apache Tomcat
- Docker - NodeJS
- Docker - NodeJS with hostname
- Docker Compose - NodeJS with MongoDB
- Docker - Prometheus and Grafana with Docker-compose
- Docker - StatsD/Graphite/Grafana
- Docker - Deploying a Java EE JBoss/WildFly Application on AWS Elastic Beanstalk Using Docker Containers
- Docker : NodeJS with GCP Kubernetes Engine
- Docker : Jenkins Multibranch Pipeline with Jenkinsfile and Github
- Docker : Jenkins Master and Slave
- Docker - ELK : ElasticSearch, Logstash, and Kibana
- Docker - ELK 7.6 : Elasticsearch on Centos 7
- Docker - ELK 7.6 : Filebeat on Centos 7
- Docker - ELK 7.6 : Logstash on Centos 7
- Docker - ELK 7.6 : Kibana on Centos 7
- Docker - ELK 7.6 : Elastic Stack with Docker Compose
- Docker - Deploy Elastic Cloud on Kubernetes (ECK) via Elasticsearch operator on minikube
- Docker - Deploy Elastic Stack via Helm on minikube
- Docker Compose - A gentle introduction with WordPress
- Docker Compose - MySQL
- MEAN Stack app on Docker containers : micro services
- MEAN Stack app on Docker containers : micro services via docker-compose
- Docker Compose - Hashicorp's Vault and Consul Part A (install vault, unsealing, static secrets, and policies)
- Docker Compose - Hashicorp's Vault and Consul Part B (EaaS, dynamic secrets, leases, and revocation)
- Docker Compose - Hashicorp's Vault and Consul Part C (Consul)
- Docker Compose with two containers - Flask REST API service container and an Apache server container
- Docker compose : Nginx reverse proxy with multiple containers
- Docker & Kubernetes : Envoy - Getting started
- Docker & Kubernetes : Envoy - Front Proxy
- Docker & Kubernetes : Ambassador - Envoy API Gateway on Kubernetes
- Docker Packer
- Docker Cheat Sheet
- Docker Q & A #1
- Kubernetes Q & A - Part I
- Kubernetes Q & A - Part II
- Docker - Run a React app in a docker
- Docker - Run a React app in a docker II (snapshot app with nginx)
- Docker - NodeJS and MySQL app with React in a docker
- Docker - Step by Step NodeJS and MySQL app with React - I
- Installing LAMP via puppet on Docker
- Docker install via Puppet
- Nginx Docker install via Ansible
- Apache Hadoop CDH 5.8 Install with QuickStarts Docker
- Docker - Deploying Flask app to ECS
- Docker Compose - Deploying WordPress to AWS
- Docker - WordPress Deploy to ECS with Docker-Compose (ECS-CLI EC2 type)
- Docker - WordPress Deploy to ECS with Docker-Compose (ECS-CLI Fargate type)
- Docker - ECS Fargate
- Docker - AWS ECS service discovery with Flask and Redis
- Docker & Kubernetes : minikube
- Docker & Kubernetes 2 : minikube Django with Postgres - persistent volume
- Docker & Kubernetes 3 : minikube Django with Redis and Celery
- Docker & Kubernetes 4 : Django with RDS via AWS Kops
- Docker & Kubernetes : Kops on AWS
- Docker & Kubernetes : Ingress controller on AWS with Kops
- Docker & Kubernetes : HashiCorp's Vault and Consul on minikube
- Docker & Kubernetes : HashiCorp's Vault and Consul - Auto-unseal using Transit Secrets Engine
- Docker & Kubernetes : Persistent Volumes & Persistent Volumes Claims - hostPath and annotations
- Docker & Kubernetes : Persistent Volumes - Dynamic volume provisioning
- Docker & Kubernetes : DaemonSet
- Docker & Kubernetes : Secrets
- Docker & Kubernetes : kubectl command
- Docker & Kubernetes : Assign a Kubernetes Pod to a particular node in a Kubernetes cluster
- Docker & Kubernetes : Configure a Pod to Use a ConfigMap
- AWS : EKS (Elastic Container Service for Kubernetes)
- Docker & Kubernetes : Run a React app in a minikube
- Docker & Kubernetes : Minikube install on AWS EC2
- Docker & Kubernetes : Cassandra with a StatefulSet
- Docker & Kubernetes : Terraform and AWS EKS
- Docker & Kubernetes : Pods and Service definitions
- Docker & Kubernetes : Service IP and the Service Type
- Docker & Kubernetes : Kubernetes DNS with Pods and Services
- Docker & Kubernetes : Headless service and discovering pods
- Docker & Kubernetes : Scaling and Updating application
- Docker & Kubernetes : Horizontal pod autoscaler on minikubes
- Docker & Kubernetes : From a monolithic app to micro services on GCP Kubernetes
- Docker & Kubernetes : Rolling updates
- Docker & Kubernetes : Deployments to GKE (Rolling update, Canary and Blue-green deployments)
- Docker & Kubernetes : Slack Chat Bot with NodeJS on GCP Kubernetes
- Docker & Kubernetes : Continuous Delivery with Jenkins Multibranch Pipeline for Dev, Canary, and Production Environments on GCP Kubernetes
- Docker & Kubernetes : NodePort vs LoadBalancer vs Ingress
- Docker & Kubernetes : MongoDB / MongoExpress on Minikube
- Docker & Kubernetes : Load Testing with Locust on GCP Kubernetes
- Docker & Kubernetes : MongoDB with StatefulSets on GCP Kubernetes Engine
- Docker & Kubernetes : Nginx Ingress Controller on Minikube
- Docker & Kubernetes : Setting up Ingress with NGINX Controller on Minikube (Mac)
- Docker & Kubernetes : Nginx Ingress Controller for Dashboard service on Minikube
- Docker & Kubernetes : Nginx Ingress Controller on GCP Kubernetes
- Docker & Kubernetes : Kubernetes Ingress with AWS ALB Ingress Controller in EKS
- Docker & Kubernetes : Setting up a private cluster on GCP Kubernetes
- Docker & Kubernetes : Kubernetes Namespaces (default, kube-public, kube-system) and switching namespaces (kubens)
- Docker & Kubernetes : StatefulSets on minikube
- Docker & Kubernetes : RBAC
- Docker & Kubernetes Service Account, RBAC, and IAM
- Docker & Kubernetes - Kubernetes Service Account, RBAC, IAM with EKS ALB, Part 1
- Docker & Kubernetes : Helm Chart
- Docker & Kubernetes : My first Helm deploy
- Docker & Kubernetes : Readiness and Liveness Probes
- Docker & Kubernetes : Helm chart repository with Github pages
- Docker & Kubernetes : Deploying WordPress and MariaDB with Ingress to Minikube using Helm Chart
- Docker & Kubernetes : Deploying WordPress and MariaDB to AWS using Helm 2 Chart
- Docker & Kubernetes : Deploying WordPress and MariaDB to AWS using Helm 3 Chart
- Docker & Kubernetes : Helm Chart for Node/Express and MySQL with Ingress
- Docker & Kubernetes : Deploy Prometheus and Grafana using Helm and Prometheus Operator - Monitoring Kubernetes node resources out of the box
- Docker & Kubernetes : Deploy Prometheus and Grafana using kube-prometheus-stack Helm Chart
- Docker & Kubernetes : Istio (service mesh) sidecar proxy on GCP Kubernetes
- Docker & Kubernetes : Istio on EKS
- Docker & Kubernetes : Istio on Minikube with AWS EC2 for Bookinfo Application
- Docker & Kubernetes : Deploying .NET Core app to Kubernetes Engine and configuring its traffic managed by Istio (Part I)
- Docker & Kubernetes : Deploying .NET Core app to Kubernetes Engine and configuring its traffic managed by Istio (Part II - Prometheus, Grafana, pin a service, split traffic, and inject faults)
- Docker & Kubernetes : Helm Package Manager with MySQL on GCP Kubernetes Engine
- Docker & Kubernetes : Deploying Memcached on Kubernetes Engine
- Docker & Kubernetes : EKS Control Plane (API server) Metrics with Prometheus
- Docker & Kubernetes : Spinnaker on EKS with Halyard
- Docker & Kubernetes : Continuous Delivery Pipelines with Spinnaker and Kubernetes Engine
- Docker & Kubernetes : Multi-node Local Kubernetes cluster : Kubeadm-dind (docker-in-docker)
- Docker & Kubernetes : Multi-node Local Kubernetes cluster : Kubeadm-kind (k8s-in-docker)
- Docker & Kubernetes : nodeSelector, nodeAffinity, taints/tolerations, pod affinity and anti-affinity - Assigning Pods to Nodes
- Docker & Kubernetes : Jenkins-X on EKS
- Docker & Kubernetes : ArgoCD App of Apps with Heml on Kubernetes
- Docker & Kubernetes : ArgoCD on Kubernetes cluster
- Docker & Kubernetes : GitOps with ArgoCD for Continuous Delivery to Kubernetes clusters (minikube) - guestbook
Ph.D. / Golden Gate Ave, San Francisco / Seoul National Univ / Carnegie Mellon / UC Berkeley / DevOps / Deep Learning / Visualization