Docker & Kubernetes : Deploy Prometheus and Grafana using Helm and Prometheus Operator - Monitoring Kubernetes node resources out of the box
Note: Operator for Prometheus has been deprecated. To deploy, please check out Docker & Kubernetes : Deploy Prometheus and Grafana using kube-prometheus-stack Helm Chart.
Since its intruction in 2016 by CoreOS, the operators are rapidly becoming the standard way of managing applications on Kubernetes especially the ones which are stateful in nature.
Whenever we deploy our application on Kubernetes cluster, we leverage multiple Kubernetes objects such as deployment, service, role, config map, ingress, etc. However, as our application gets complex, managing our application only with the native Kubernetes objects becomes difficult.
While Kubernetes manages a complete lifecycle of stateless application, it cannot manage (automate) the lifecycle of stateless application.
Combined with CRDs (custom resource definitions) and custom controllers, operators eliminate the requirement for manual intervention while performing such tasks as upgrading, handling failure recovery, and scaling stateful applications.
In summary, by using operators, we can simplify and standardize the management of complex applications and stateful workloads within our Kubernetes cluster. This approach aligns with the principles of GitOps and declarative infrastructure, which aim to specify the desired state of our infrastructure and applications as code.
There are great and Kubernetes ready apps in public repository.
Is any Helm chart for Prometheus with Operator?
$ helm search prometheus
NAME                                 	CHART VERSION	APP VERSION	DESCRIPTION
stable/prometheus                    	11.12.0      	2.20.1     	Prometheus is a monitoring system and time series database.
stable/prometheus-adapter            	2.5.0        	v0.7.0     	A Helm chart for k8s prometheus adapter
stable/prometheus-blackbox-exporter  	4.3.0        	0.16.0     	Prometheus Blackbox Exporter
stable/prometheus-cloudwatch-exporter	0.8.3        	0.8.0      	A Helm chart for prometheus cloudwatch-exporter
stable/prometheus-consul-exporter    	0.1.5        	0.4.0      	A Helm chart for the Prometheus Consul Exporter
stable/prometheus-couchdb-exporter   	0.1.1        	1.0        	A Helm chart to export the metrics from couchdb in Promet...
stable/prometheus-mongodb-exporter   	2.8.0        	v0.10.0    	A Prometheus exporter for MongoDB metrics
stable/prometheus-mysql-exporter     	0.7.0        	v0.11.0    	A Helm chart for prometheus mysql exporter with cloudsqlp...
stable/prometheus-nats-exporter      	2.5.0        	0.6.2      	A Helm chart for prometheus-nats-exporter
stable/prometheus-node-exporter      	1.11.1       	1.0.1      	A Helm chart for prometheus node-exporter
stable/prometheus-operator           	9.3.1        	0.38.1     	Provides easy monitoring definitions for Kubernetes servi...
stable/prometheus-postgres-exporter  	1.3.0        	0.8.0      	A Helm chart for prometheus postgres-exporter
stable/prometheus-pushgateway        	1.4.1        	1.2.0      	A Helm chart for prometheus pushgateway
stable/prometheus-rabbitmq-exporter  	0.5.5        	v0.29.0    	Rabbitmq metrics exporter for prometheus
stable/prometheus-redis-exporter     	3.5.0        	1.3.4      	Prometheus exporter for Redis metrics
stable/prometheus-snmp-exporter      	0.0.5        	0.14.0     	Prometheus SNMP Exporter
stable/prometheus-to-sd              	0.3.0        	0.5.2      	Scrape metrics stored in prometheus format and push them ...
stable/elasticsearch-exporter        	3.7.0        	1.1.0      	Elasticsearch stats exporter for Prometheus
stable/helm-exporter                 	0.3.3        	0.4.0      	DEPRECATED Exports helm release stats to prometheus
stable/karma                         	1.5.2        	v0.68      	A Helm chart for Karma - an UI for Prometheus Alertmanager
stable/stackdriver-exporter          	1.2.3        	0.6.0      	Stackdriver exporter for Prometheus
stable/weave-cloud                   	0.3.7        	1.4.0      	Weave Cloud is a add-on to Kubernetes which provides Cont...
stable/kube-state-metrics            	2.8.14       	1.9.7      	Install kube-state-metrics to generate and expose cluster...
stable/kuberhealthy                  	1.2.6        	v1.0.2     	The official Helm chart for Kuberhealthy.
stable/mariadb                       	7.3.14       	10.3.22    	DEPRECATED Fast, reliable, scalable, and easy to use open...
Ok, we can use the one we found.
The following command deploys prometheus-operator on the Kubernetes cluster in the default configuration. The default installation includes Prometheus Operator, Alertmanager, Grafana, and configuration for scraping Kubernetes infrastructure.
$ helm install --name my-release stable/prometheus-operator
NAME:   my-release
LAST DEPLOYED: Fri Aug 14 21:07:56 2020
NAMESPACE: default
STATUS: DEPLOYED
...
Done!
Everything has been deployed: pod/containers/services/secrets for Prometheus and Grafana.
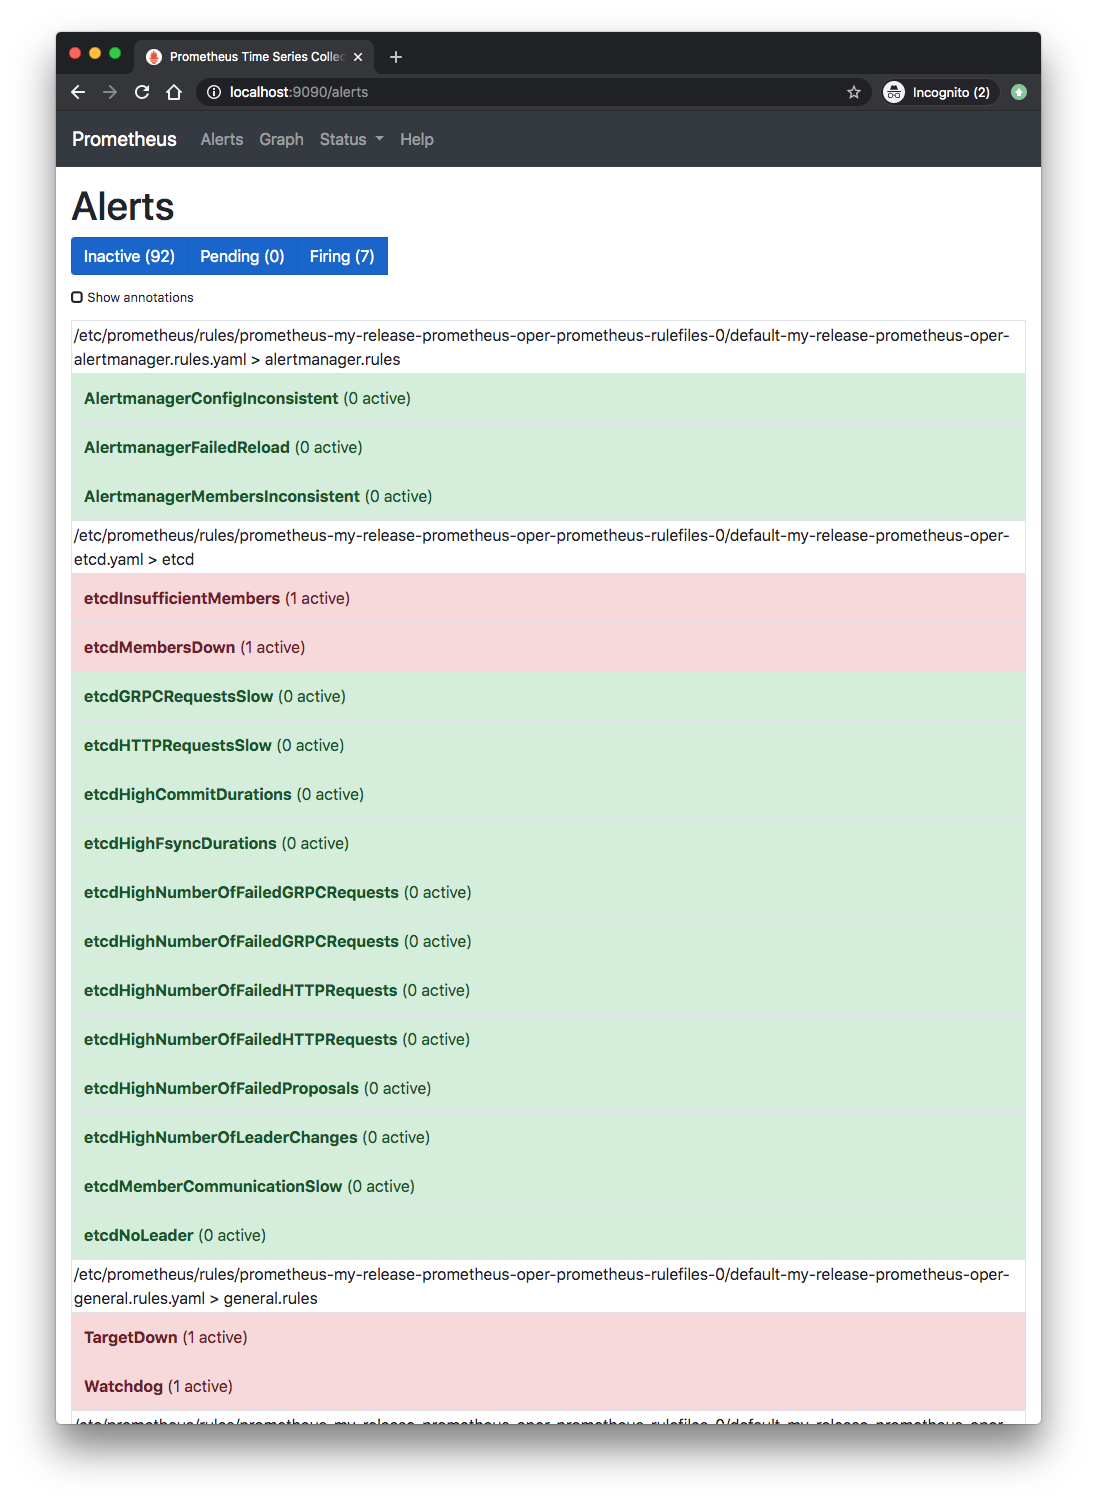
Now, we can not only monitor cluster and pod health but also has default alerting systm is in place.
We have Grafana dashboard and Prometheus UI as well.
We'll get to the internal details later sections of this post.
The chart repo is available from https://github.com/helm/charts/tree/master/stable/prometheus-operator.
When we look at the deployed services, the service types are all ClusterIP types. That means they are cluster internal and we cannot access them from outside:
$ kubectl get svc
NAME                                      TYPE        CLUSTER-IP       EXTERNAL-IP   PORT(S)                      AGE
alertmanager-operated                     ClusterIP   None             <none>        9093/TCP,9094/TCP,9094/UDP   47m
kubernetes                                ClusterIP   10.96.0.1        <none>        443/TCP                      63m
my-release-grafana                        ClusterIP   10.110.28.33     <none>        80/TCP                       47m
my-release-kube-state-metrics             ClusterIP   10.104.105.71    <none>        8080/TCP                     47m
my-release-prometheus-node-exporter       ClusterIP   10.104.199.145   <none>        9100/TCP                     47m
my-release-prometheus-oper-alertmanager   ClusterIP   10.103.236.215   <none>        9093/TCP                     47m
my-release-prometheus-oper-operator       ClusterIP   10.105.131.82    <none>        8080/TCP,443/TCP             47m
my-release-prometheus-oper-prometheus     ClusterIP   10.99.31.103     <none>        9090/TCP                     47m
prometheus-operated                       ClusterIP   None             <none>        9090/TCP                     46m
We'll use kubectl port-forward which is useful for testing/debugging purposes because we can access our service locally without exposing it:
Kubernetes back-end services not intended for remote exposure.
Let's get the port of the Grafana from the container:
$ kubectl get pod
NAME                                                     READY   STATUS    RESTARTS   AGE
alertmanager-my-release-prometheus-oper-alertmanager-0   2/2     Running   0          59m
my-release-grafana-9c8fb59b6-bgktk                       2/2     Running   0          59m
my-release-kube-state-metrics-844f86b568-6p54b           1/1     Running   0          59m
my-release-prometheus-node-exporter-vwjhq                1/1     Running   0          59m
my-release-prometheus-oper-operator-6497fd9d4f-tjtht     2/2     Running   0          59m
prometheus-my-release-prometheus-oper-prometheus-0       3/3     Running   1          59m

$ kubectl logs my-release-grafana-9c8fb59b6-bgktk -c grafana
...
t=2020-08-15T04:09:51+0000 lvl=info msg="Created default admin" logger=sqlstore user=admin
t=2020-08-15T04:09:51+0000 lvl=info msg="Starting plugin search" logger=plugins
t=2020-08-15T04:09:51+0000 lvl=info msg="Registering plugin" logger=plugins name="Direct Input"
t=2020-08-15T04:09:51+0000 lvl=info msg="inserting datasource from configuration " logger=provisioning.datasources name=Prometheus uid=
t=2020-08-15T04:09:51+0000 lvl=info msg="HTTP Server Listen" logger=http.server address=[::]:3000  protocol=http subUrl= socket=
t=2020-08-15T05:06:57+0000 lvl=info msg="Request Completed" logger=context userId=0 orgId=0 uname= method=GET path=/ status=302 remote_addr=127.0.0.1 time_ms=1 size=29 referer=
From the logs we got the default Grafana user=admin, we can get the password from https://github.com/helm/charts/tree/master/stable/prometheus-operator:

As discussed earlier, the kubectl port-forward command establishes a tunnel from the target pod to our localhost.
The command requires us to define the type or name of the resource as well as local and remote port numbers:
kubectl port-forward TYPE/NAME [options] LOCAL_PORT:REMOTE_PORT
Now, we are almost ready to use Grafana. Just do a port-forward. We'll use deployment to select port-forward pod:
$ kubectl get deployment
NAME                                  READY   UP-TO-DATE   AVAILABLE   AGE
my-release-grafana                    1/1     1            1           52m
my-release-kube-state-metrics         1/1     1            1           52m
my-release-prometheus-oper-operator   1/1     1            1           52m

$ kubectl port-forward deployment/my-release-grafana  3000
Forwarding from 127.0.0.1:3000 -> 3000
Forwarding from [::1]:3000 -> 3000
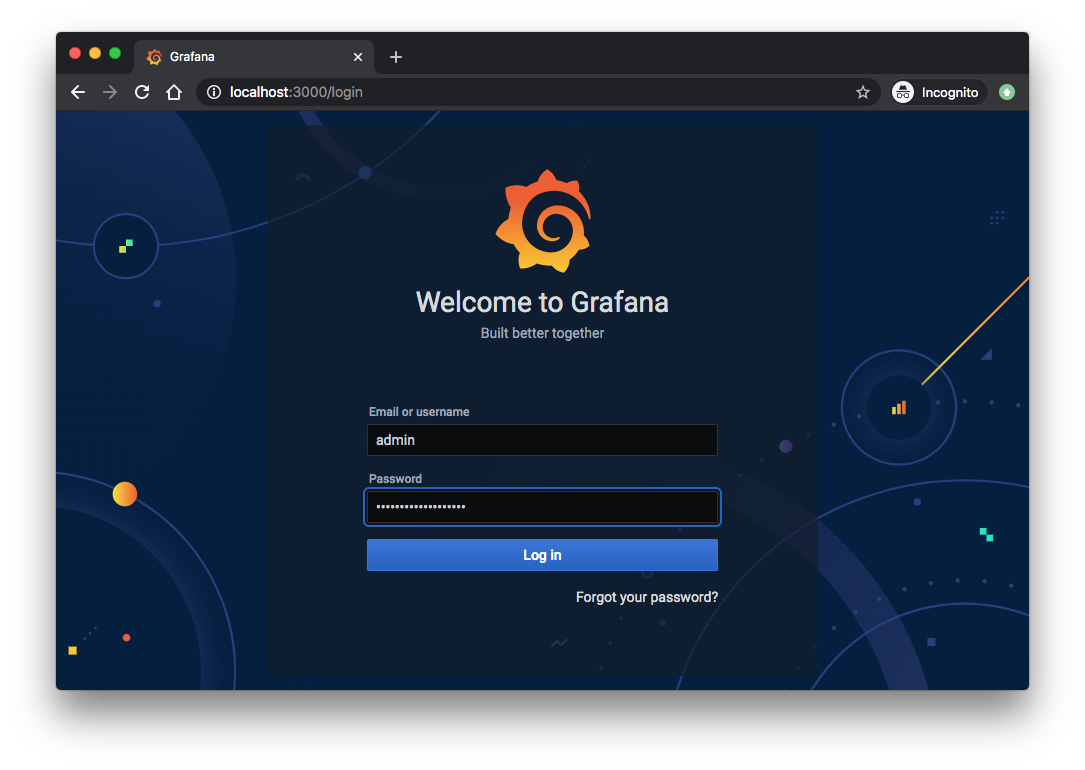
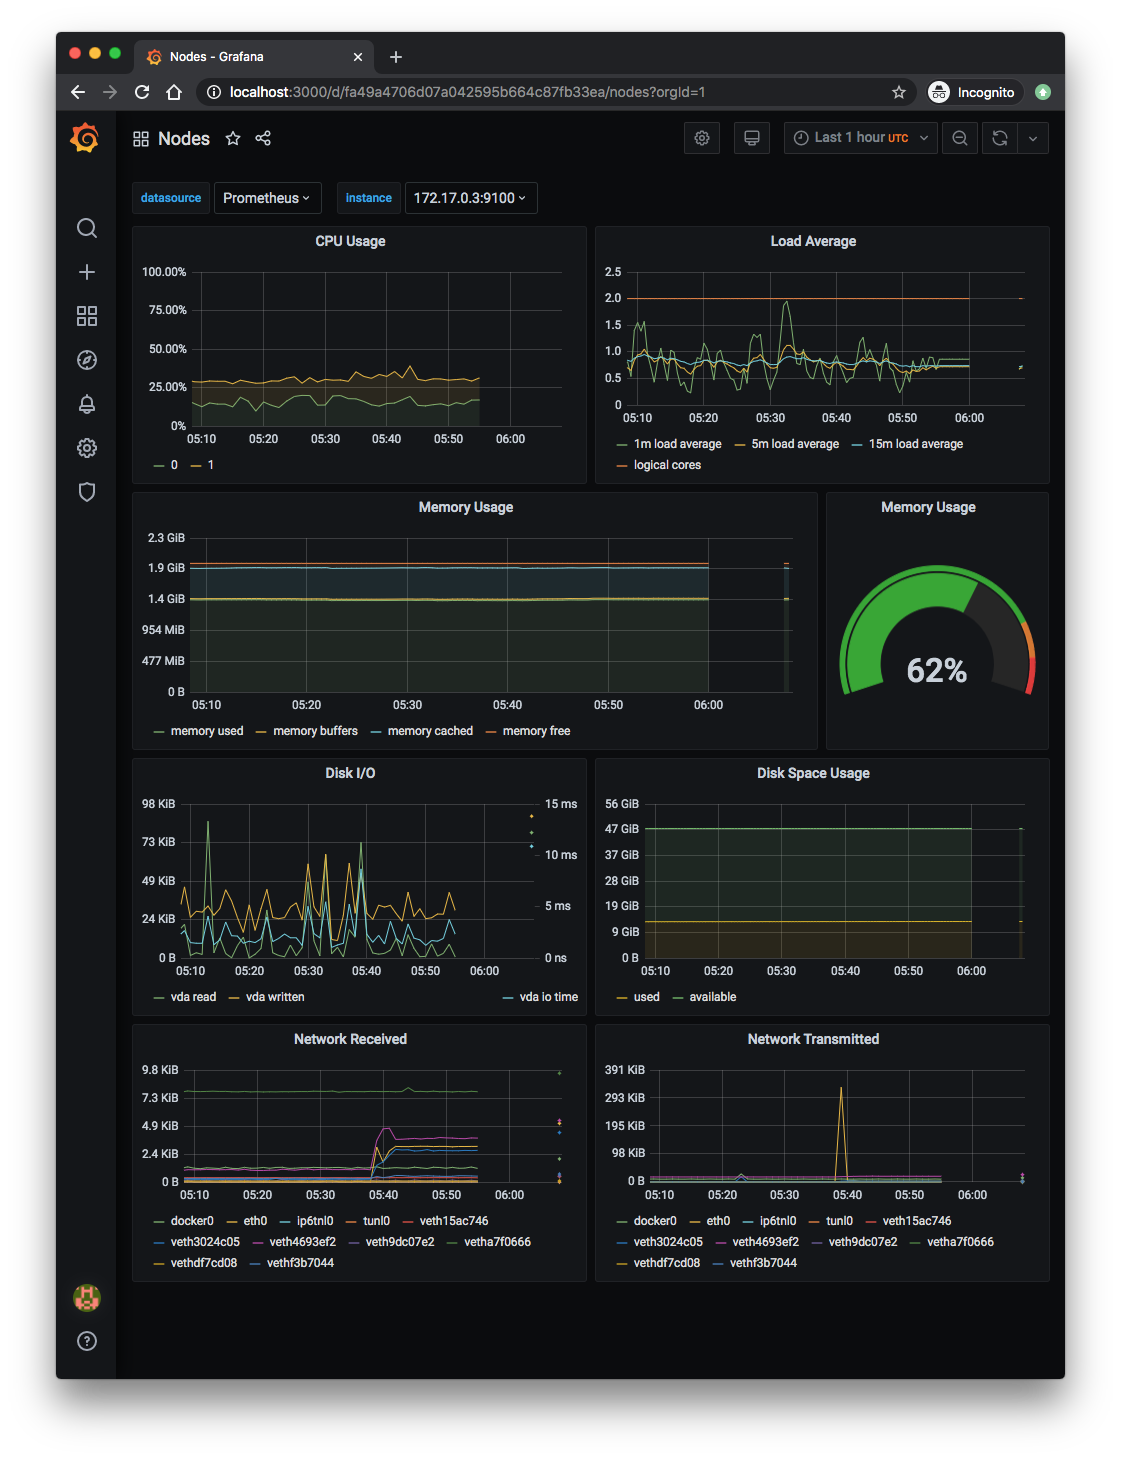
Login and select Manage:
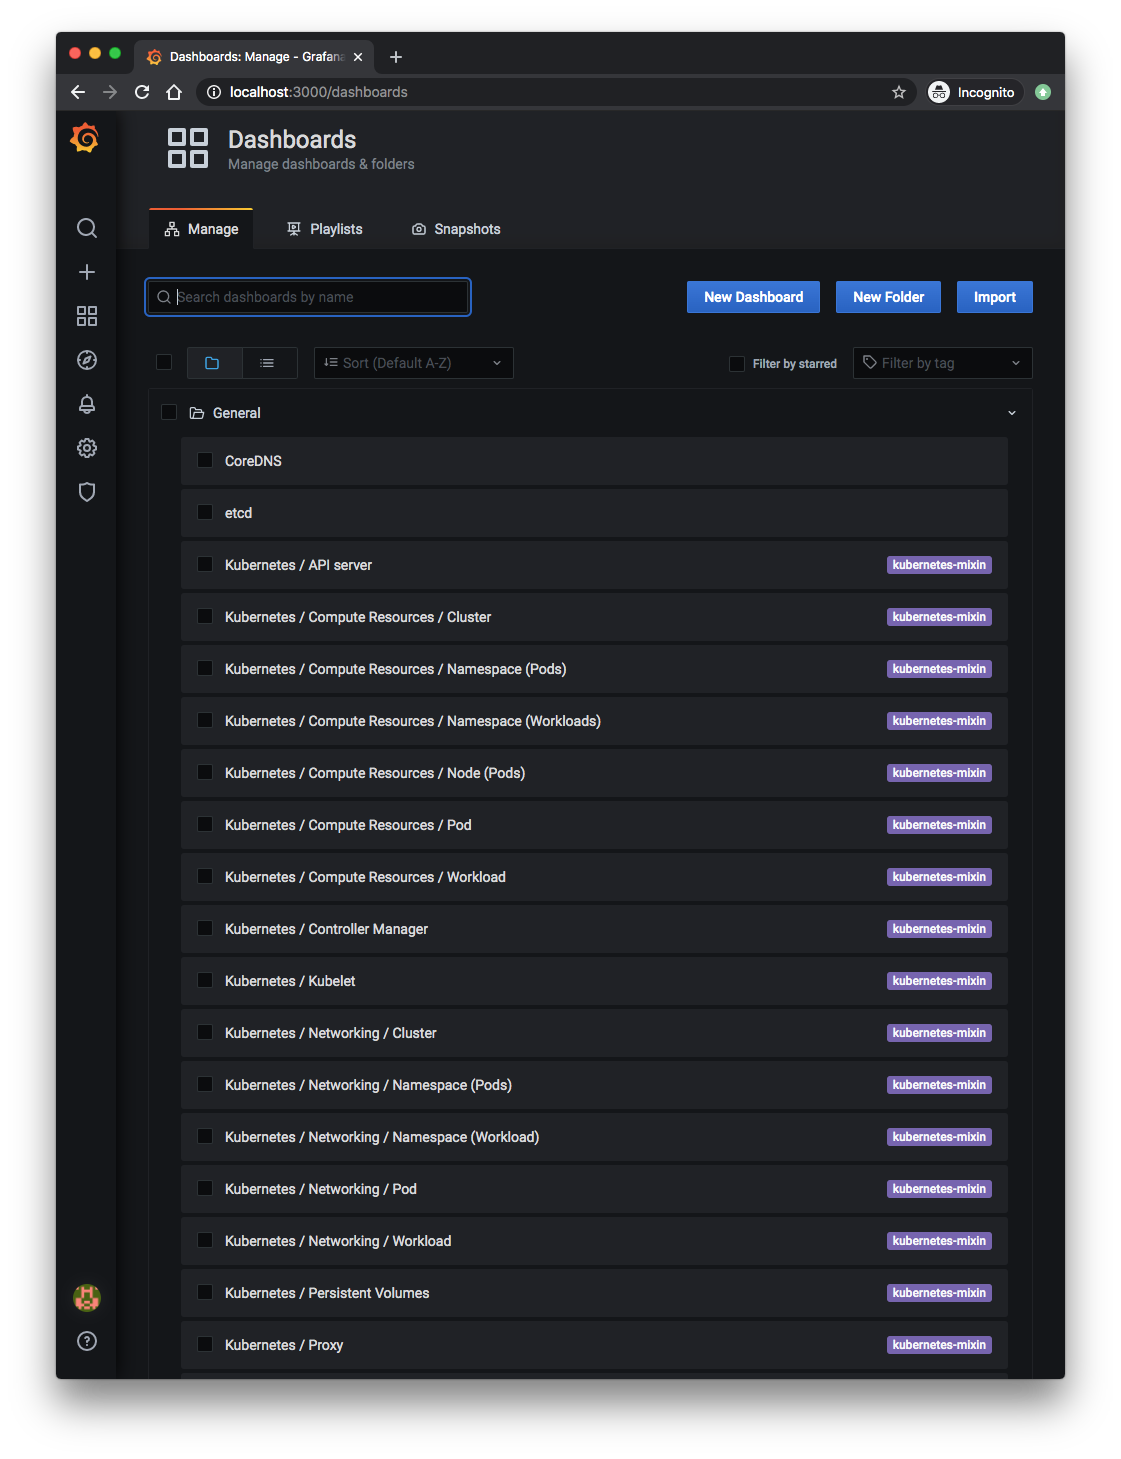
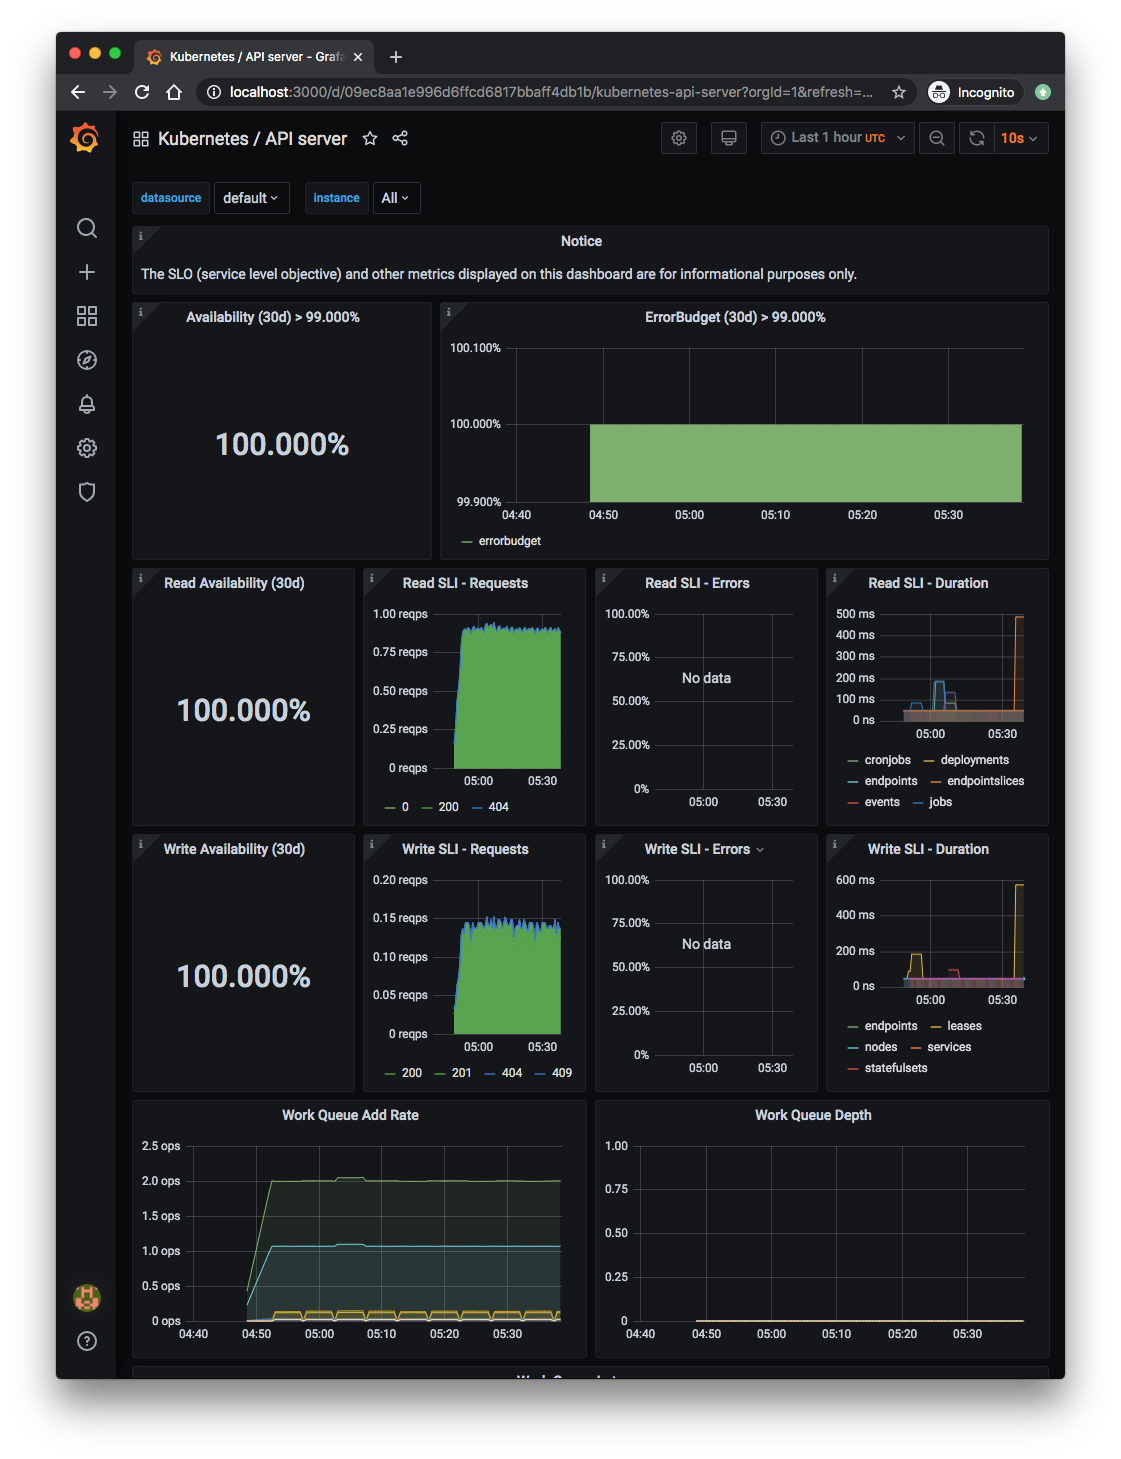
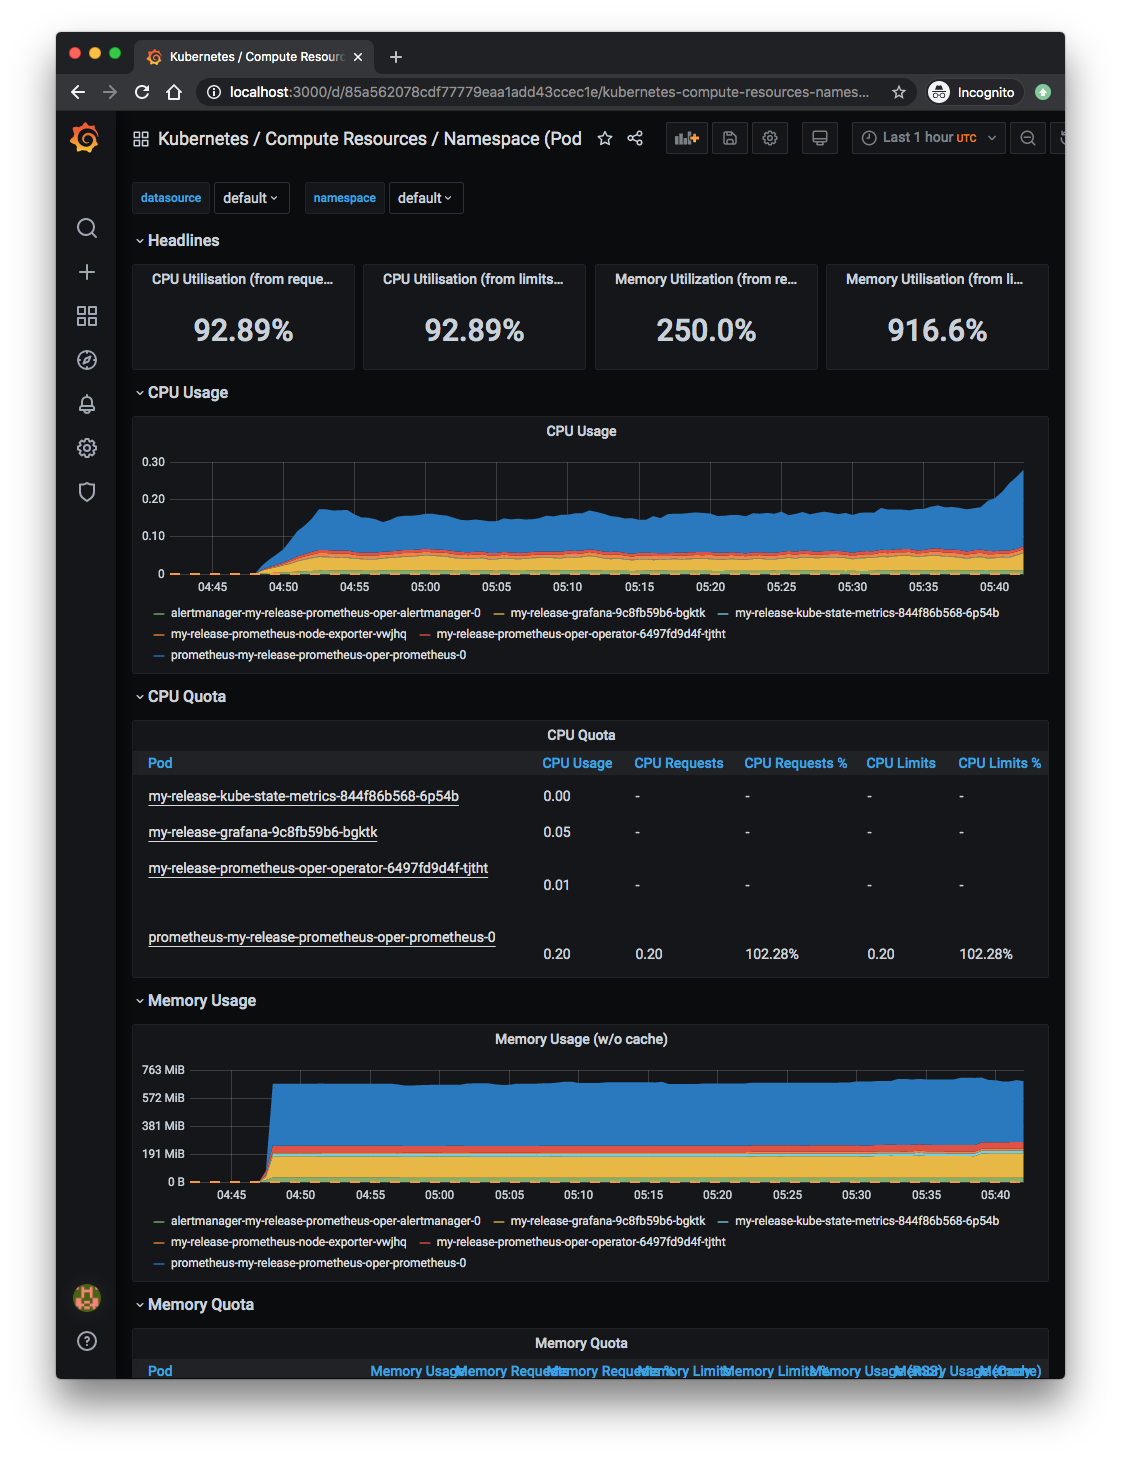
Lots of monitoring dashboards are already there: API server, cluster, nodes, pods, statefulsets, etc.
$ kubectl get pod
NAME                                                     READY   STATUS    RESTARTS   AGE
alertmanager-my-release-prometheus-oper-alertmanager-0   2/2     Running   0          121m
my-release-grafana-9c8fb59b6-bgktk                       2/2     Running   0          122m
my-release-kube-state-metrics-844f86b568-6p54b           1/1     Running   0          122m
my-release-prometheus-node-exporter-vwjhq                1/1     Running   0          122m
my-release-prometheus-oper-operator-6497fd9d4f-tjtht     2/2     Running   0          122m
prometheus-my-release-prometheus-oper-prometheus-0       3/3     Running   1          121m
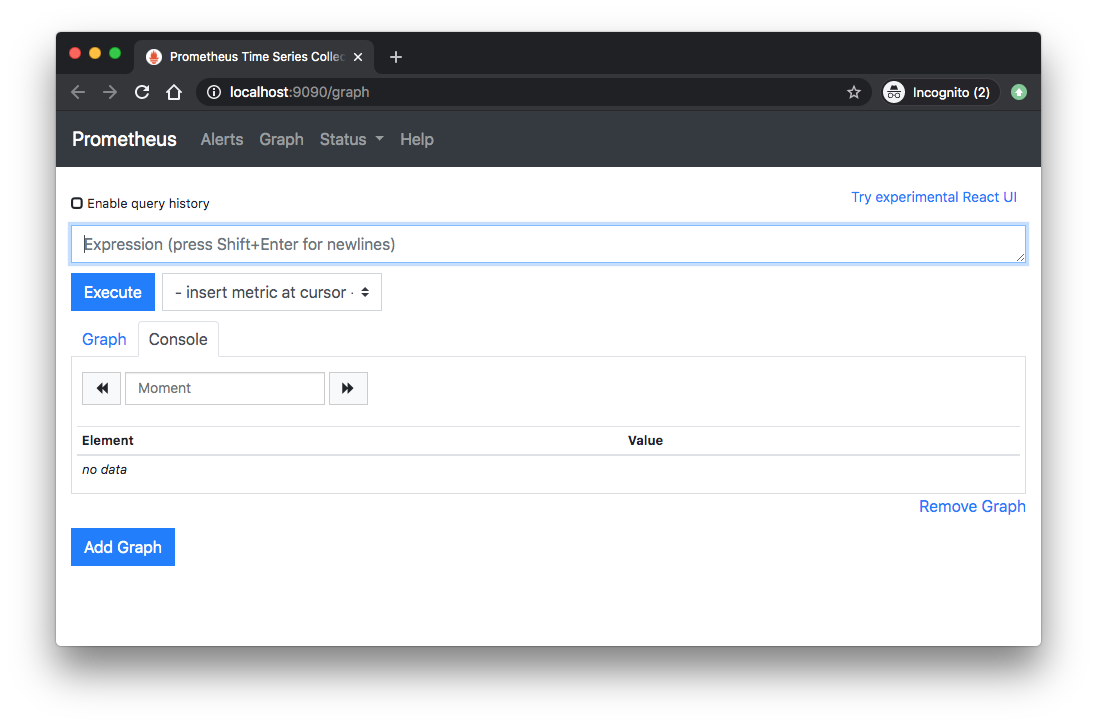
Port-forward:
$ kubectl port-forward prometheus-my-release-prometheus-oper-prometheus-0 9090
Forwarding from 127.0.0.1:9090 -> 9090
Forwarding from [::1]:9090 -> 9090
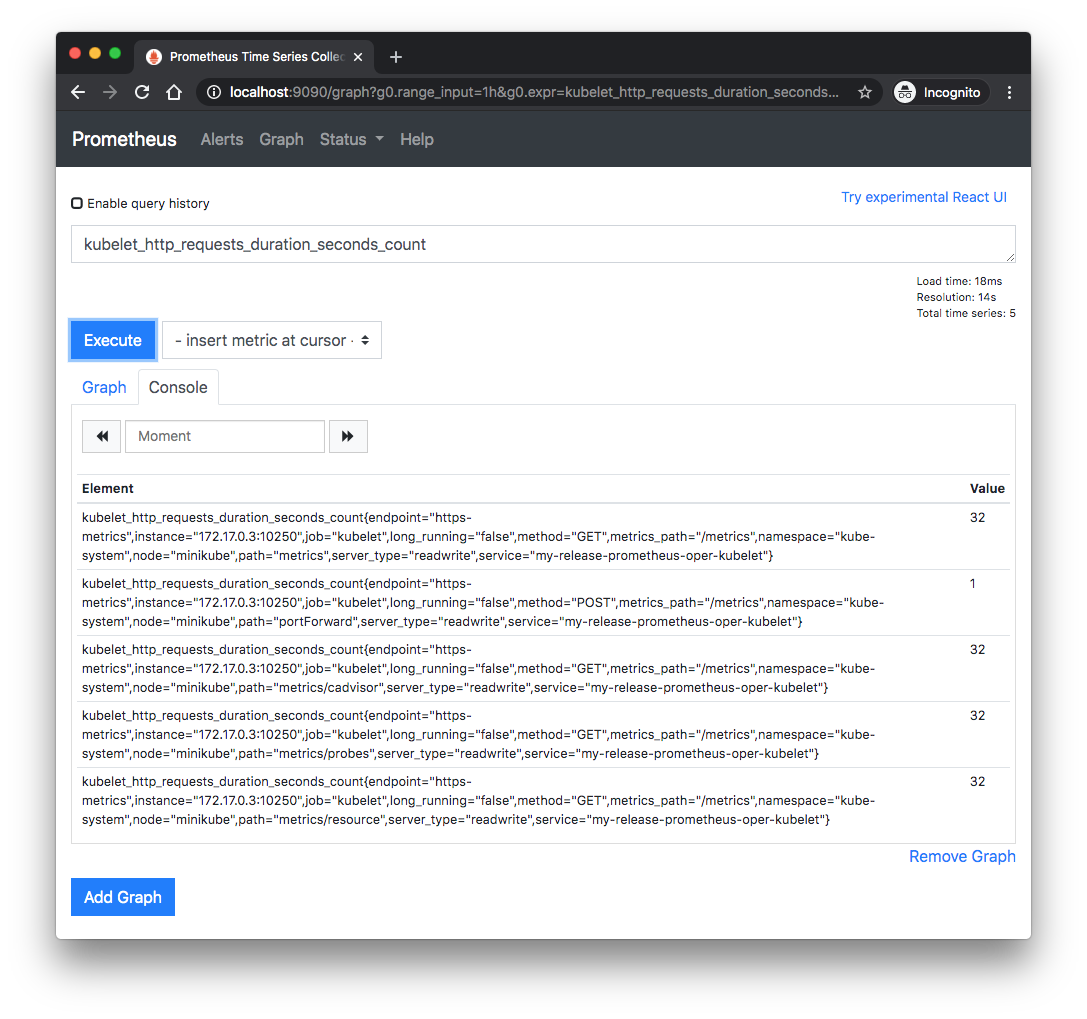
With PromQL:
Recall, we did helm install to deploy our Prometheus stack:
$ helm install --name my-release stable/prometheus-operator
We don't need to do it but let's fetch the release history:
$ helm history my-release
REVISION	UPDATED                 	STATUS  	CHART                    	APP VERSION	DESCRIPTION
1       	Sat Aug 14 22:07:39 2020	DEPLOYED	prometheus-operator-9.3.1	0.38.1     	Install complete
To undo the deploy, we may want to use helm delete with the release name:
$ helm delete --name my-release
release "my-release" deleted
Although the release has been deleted and the Prometheus no longer runs, Helm will save all the revision information for a future re-deploy. If we trying to re-install the my-release right now, we would have an error:
$ helm install --name my-release stable/prometheus-operator
Error: a release named my-release already exists.
Run: helm ls --all my-release; to check the status of the release
Or run: helm del --purge my-release; to delete it
We can see the deleted releases:
$ helm ls --deleted
NAME      	REVISION	UPDATED                 	STATUS 	CHART                    	APP VERSION	NAMESPACE
my-release	1       	Fri Aug 14 21:07:56 2020	DELETED	prometheus-operator-9.3.1	0.38.1     	default

$ helm ls --all my-release
NAME      	REVISION	UPDATED                 	STATUS 	CHART                    	APP VERSION	NAMESPACE
my-release	1       	Fri Aug 14 21:07:56 2020	DELETED	prometheus-operator-9.3.1	0.38.1     	default
Lastly, let's purge it:
$ helm del --purge my-release
release "my-release" deleted

$ helm ls --all my-release
$
Now, the Prometheus release (my-release) has been completely removed, and the release name can be reused.
Docker & K8s
- Docker install on Amazon Linux AMI
- Docker install on EC2 Ubuntu 14.04
- Docker container vs Virtual Machine
- Docker install on Ubuntu 14.04
- Docker Hello World Application
- Nginx image - share/copy files, Dockerfile
- Working with Docker images : brief introduction
- Docker image and container via docker commands (search, pull, run, ps, restart, attach, and rm)
- More on docker run command (docker run -it, docker run --rm, etc.)
- Docker Networks - Bridge Driver Network
- Docker Persistent Storage
- File sharing between host and container (docker run -d -p -v)
- Linking containers and volume for datastore
- Dockerfile - Build Docker images automatically I - FROM, MAINTAINER, and build context
- Dockerfile - Build Docker images automatically II - revisiting FROM, MAINTAINER, build context, and caching
- Dockerfile - Build Docker images automatically III - RUN
- Dockerfile - Build Docker images automatically IV - CMD
- Dockerfile - Build Docker images automatically V - WORKDIR, ENV, ADD, and ENTRYPOINT
- Docker - Apache Tomcat
- Docker - NodeJS
- Docker - NodeJS with hostname
- Docker Compose - NodeJS with MongoDB
- Docker - Prometheus and Grafana with Docker-compose
- Docker - StatsD/Graphite/Grafana
- Docker - Deploying a Java EE JBoss/WildFly Application on AWS Elastic Beanstalk Using Docker Containers
- Docker : NodeJS with GCP Kubernetes Engine
- Docker : Jenkins Multibranch Pipeline with Jenkinsfile and Github
- Docker : Jenkins Master and Slave
- Docker - ELK : ElasticSearch, Logstash, and Kibana
- Docker - ELK 7.6 : Elasticsearch on Centos 7
- Docker - ELK 7.6 : Filebeat on Centos 7
- Docker - ELK 7.6 : Logstash on Centos 7
- Docker - ELK 7.6 : Kibana on Centos 7
- Docker - ELK 7.6 : Elastic Stack with Docker Compose
- Docker - Deploy Elastic Cloud on Kubernetes (ECK) via Elasticsearch operator on minikube
- Docker - Deploy Elastic Stack via Helm on minikube
- Docker Compose - A gentle introduction with WordPress
- Docker Compose - MySQL
- MEAN Stack app on Docker containers : micro services
- MEAN Stack app on Docker containers : micro services via docker-compose
- Docker Compose - Hashicorp's Vault and Consul Part A (install vault, unsealing, static secrets, and policies)
- Docker Compose - Hashicorp's Vault and Consul Part B (EaaS, dynamic secrets, leases, and revocation)
- Docker Compose - Hashicorp's Vault and Consul Part C (Consul)
- Docker Compose with two containers - Flask REST API service container and an Apache server container
- Docker compose : Nginx reverse proxy with multiple containers
- Docker & Kubernetes : Envoy - Getting started
- Docker & Kubernetes : Envoy - Front Proxy
- Docker & Kubernetes : Ambassador - Envoy API Gateway on Kubernetes
- Docker Packer
- Docker Cheat Sheet
- Docker Q & A #1
- Kubernetes Q & A - Part I
- Kubernetes Q & A - Part II
- Docker - Run a React app in a docker
- Docker - Run a React app in a docker II (snapshot app with nginx)
- Docker - NodeJS and MySQL app with React in a docker
- Docker - Step by Step NodeJS and MySQL app with React - I
- Installing LAMP via puppet on Docker
- Docker install via Puppet
- Nginx Docker install via Ansible
- Apache Hadoop CDH 5.8 Install with QuickStarts Docker
- Docker - Deploying Flask app to ECS
- Docker Compose - Deploying WordPress to AWS
- Docker - WordPress Deploy to ECS with Docker-Compose (ECS-CLI EC2 type)
- Docker - WordPress Deploy to ECS with Docker-Compose (ECS-CLI Fargate type)
- Docker - ECS Fargate
- Docker - AWS ECS service discovery with Flask and Redis
- Docker & Kubernetes : minikube
- Docker & Kubernetes 2 : minikube Django with Postgres - persistent volume
- Docker & Kubernetes 3 : minikube Django with Redis and Celery
- Docker & Kubernetes 4 : Django with RDS via AWS Kops
- Docker & Kubernetes : Kops on AWS
- Docker & Kubernetes : Ingress controller on AWS with Kops
- Docker & Kubernetes : HashiCorp's Vault and Consul on minikube
- Docker & Kubernetes : HashiCorp's Vault and Consul - Auto-unseal using Transit Secrets Engine
- Docker & Kubernetes : Persistent Volumes & Persistent Volumes Claims - hostPath and annotations
- Docker & Kubernetes : Persistent Volumes - Dynamic volume provisioning
- Docker & Kubernetes : DaemonSet
- Docker & Kubernetes : Secrets
- Docker & Kubernetes : kubectl command
- Docker & Kubernetes : Assign a Kubernetes Pod to a particular node in a Kubernetes cluster
- Docker & Kubernetes : Configure a Pod to Use a ConfigMap
- AWS : EKS (Elastic Container Service for Kubernetes)
- Docker & Kubernetes : Run a React app in a minikube
- Docker & Kubernetes : Minikube install on AWS EC2
- Docker & Kubernetes : Cassandra with a StatefulSet
- Docker & Kubernetes : Terraform and AWS EKS
- Docker & Kubernetes : Pods and Service definitions
- Docker & Kubernetes : Service IP and the Service Type
- Docker & Kubernetes : Kubernetes DNS with Pods and Services
- Docker & Kubernetes : Headless service and discovering pods
- Docker & Kubernetes : Scaling and Updating application
- Docker & Kubernetes : Horizontal pod autoscaler on minikubes
- Docker & Kubernetes : From a monolithic app to micro services on GCP Kubernetes
- Docker & Kubernetes : Rolling updates
- Docker & Kubernetes : Deployments to GKE (Rolling update, Canary and Blue-green deployments)
- Docker & Kubernetes : Slack Chat Bot with NodeJS on GCP Kubernetes
- Docker & Kubernetes : Continuous Delivery with Jenkins Multibranch Pipeline for Dev, Canary, and Production Environments on GCP Kubernetes
- Docker & Kubernetes : NodePort vs LoadBalancer vs Ingress
- Docker & Kubernetes : MongoDB / MongoExpress on Minikube
- Docker & Kubernetes : Load Testing with Locust on GCP Kubernetes
- Docker & Kubernetes : MongoDB with StatefulSets on GCP Kubernetes Engine
- Docker & Kubernetes : Nginx Ingress Controller on Minikube
- Docker & Kubernetes : Setting up Ingress with NGINX Controller on Minikube (Mac)
- Docker & Kubernetes : Nginx Ingress Controller for Dashboard service on Minikube
- Docker & Kubernetes : Nginx Ingress Controller on GCP Kubernetes
- Docker & Kubernetes : Kubernetes Ingress with AWS ALB Ingress Controller in EKS
- Docker & Kubernetes : Setting up a private cluster on GCP Kubernetes
- Docker & Kubernetes : Kubernetes Namespaces (default, kube-public, kube-system) and switching namespaces (kubens)
- Docker & Kubernetes : StatefulSets on minikube
- Docker & Kubernetes : RBAC
- Docker & Kubernetes Service Account, RBAC, and IAM
- Docker & Kubernetes - Kubernetes Service Account, RBAC, IAM with EKS ALB, Part 1
- Docker & Kubernetes : Helm Chart
- Docker & Kubernetes : My first Helm deploy
- Docker & Kubernetes : Readiness and Liveness Probes
- Docker & Kubernetes : Helm chart repository with Github pages
- Docker & Kubernetes : Deploying WordPress and MariaDB with Ingress to Minikube using Helm Chart
- Docker & Kubernetes : Deploying WordPress and MariaDB to AWS using Helm 2 Chart
- Docker & Kubernetes : Deploying WordPress and MariaDB to AWS using Helm 3 Chart
- Docker & Kubernetes : Helm Chart for Node/Express and MySQL with Ingress
- Docker & Kubernetes : Deploy Prometheus and Grafana using Helm and Prometheus Operator - Monitoring Kubernetes node resources out of the box
- Docker & Kubernetes : Deploy Prometheus and Grafana using kube-prometheus-stack Helm Chart
- Docker & Kubernetes : Istio (service mesh) sidecar proxy on GCP Kubernetes
- Docker & Kubernetes : Istio on EKS
- Docker & Kubernetes : Istio on Minikube with AWS EC2 for Bookinfo Application
- Docker & Kubernetes : Deploying .NET Core app to Kubernetes Engine and configuring its traffic managed by Istio (Part I)
- Docker & Kubernetes : Deploying .NET Core app to Kubernetes Engine and configuring its traffic managed by Istio (Part II - Prometheus, Grafana, pin a service, split traffic, and inject faults)
- Docker & Kubernetes : Helm Package Manager with MySQL on GCP Kubernetes Engine
- Docker & Kubernetes : Deploying Memcached on Kubernetes Engine
- Docker & Kubernetes : EKS Control Plane (API server) Metrics with Prometheus
- Docker & Kubernetes : Spinnaker on EKS with Halyard
- Docker & Kubernetes : Continuous Delivery Pipelines with Spinnaker and Kubernetes Engine
- Docker & Kubernetes : Multi-node Local Kubernetes cluster : Kubeadm-dind (docker-in-docker)
- Docker & Kubernetes : Multi-node Local Kubernetes cluster : Kubeadm-kind (k8s-in-docker)
- Docker & Kubernetes : nodeSelector, nodeAffinity, taints/tolerations, pod affinity and anti-affinity - Assigning Pods to Nodes
- Docker & Kubernetes : Jenkins-X on EKS
- Docker & Kubernetes : ArgoCD App of Apps with Heml on Kubernetes
- Docker & Kubernetes : ArgoCD on Kubernetes cluster
- Docker & Kubernetes : GitOps with ArgoCD for Continuous Delivery to Kubernetes clusters (minikube) - guestbook
Ph.D. / Golden Gate Ave, San Francisco / Seoul National Univ / Carnegie Mellon / UC Berkeley / DevOps / Deep Learning / Visualization