Elasticsearch with Redis broker and Logstash Shipper and Indexer
Elastic Search, Logstash, Kibana
Elastic Stack docker/kubernetes series:
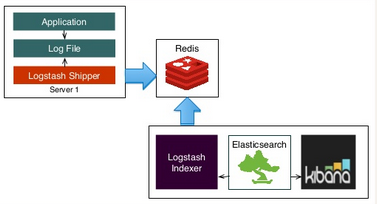
Picture credit : slideshare.net/
In this tutorial, we'll see how Elasticsearch works with Redis broker and Logstash Shipper and Indexer.
In the first part of this page, we're going to work on in one machine (monitoring server - ELK).
Then, in later part, we'll deal with two AWS instances: one for the monitoring server and the other one for Logstash as a shipper and Redis as the broker between Logstash shipper and indexer.
References:
In this tutorial, we'll use syslog file as an input to Logstash.
So, let's give Logstash permission to read the file:
$ sudo setfacl -m u:logstash:r /var/log/{syslog,auth.log}
/etc/logstash/conf.d/indexing.conf:
input {
  file {
    type => "syslog"
    path => ["/var/log/auth.log", "/var/log/syslog"]
    #start_position => beginning
    #sincedb_path => "/dev/null"
  }
}

filter {
  if [type] == "syslog" {
    grok {
      match => {
        "message" => ["%{SYSLOGPAMSESSION}", "%{CRONLOG}", "%{SYSLOGLINE}"]
      }
      # After we processed the log we don't need the raw message anymore
      overwrite => "message"
    }

    date {
      match => ["timestamp", "MMM  d HH:mm:ss", "MMM dd HH:mm:ss"]
      remove_field => ["timestamp"]
    }

    date {
      match => ["timestamp8601", "ISO8601"]
      remove_field => ["timestamp8601"]
    }
  }
}

output {
  stdout {
    codec => rubydebug
  }
}
If we want to test our filters against historical entries, we should let Logstash to start at the beginning of all files every time it runs. Obviously we don't want this in normal environments, but it sure makes debugging our filters easier.
The grok filter will short circuit upon the first matching pattern (meaning that order is important).
It also extracts certain fields from log entries, such as timestamp and program.
Depending on the timestamp format used in the log entry, the pattern will spit out either timestamp or timestamp8601.
The date filter causes Logstash to use the timestamp of the entry itself, rather than recording when Logstash recorded the entry (very important when dealing with historical log entries).
Let's run Logstash:
$ sudo -u logstash /opt/logstash/bin/logstash -f /etc/logstash/conf.d/indexing.conf
Representative stdout looks like this:
{
       "message" => "if [ -x /usr/bin/mrtg ] && [ -r /etc/mrtg.cfg ] && [ -d \"$(grep '^[[:space:]]*[^#]*[[:space:]]*WorkDir' /etc/mrtg.cfg | awk '{ print $NF }'",
      "@version" => "1",
    "@timestamp" => "2016-06-21T17:30:01.000Z",
          "path" => "/var/log/syslog",
          "host" => "laptop",
          "type" => "syslog",
     "logsource" => "laptop",
       "program" => "CRON",
           "pid" => "20610",
          "user" => "root",
        "action" => "CMD"
}
Now we know our filters work as expected, remove our debugging options from the configuration and then replace the output with the following:
output {
  elasticsearch {
    host => "localhost"
  }
  stdout {
  }
}
Now that we have a working configuration, let's start the Logstash service:
$ sudo service logstash restart
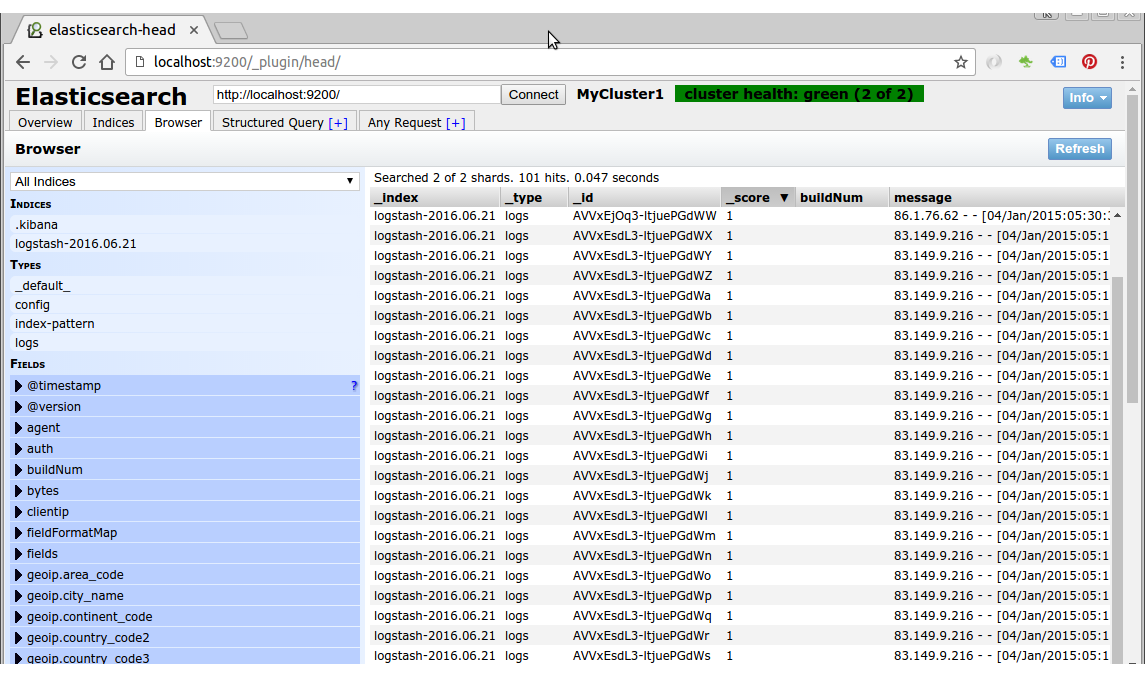
We should start seeing logs flowing in:
Here is the initial screen of Kibana before we add an index pattern:
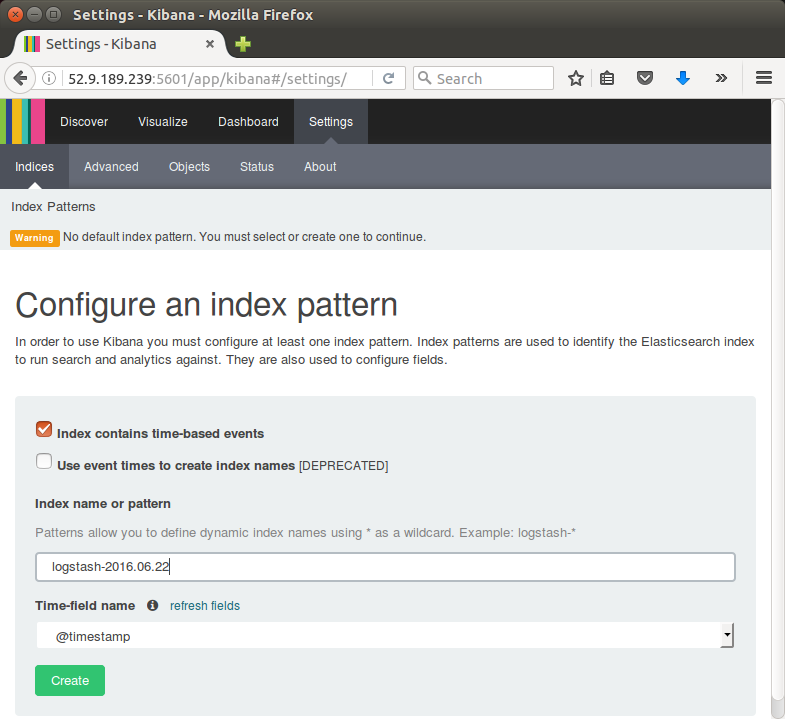
Note that the ip in the url. The AWS instance will be used as a remote server in next section of this tutorial.
Click Create to add the index pattern.
This first pattern is automatically configured as the default.
When we have more than one index pattern, we can designate which one to use as the default from Settings > Indices.
Kibana is now connected to our Elasticsearch data.
Kibana displays a read-only list of fields configured for the matching index.
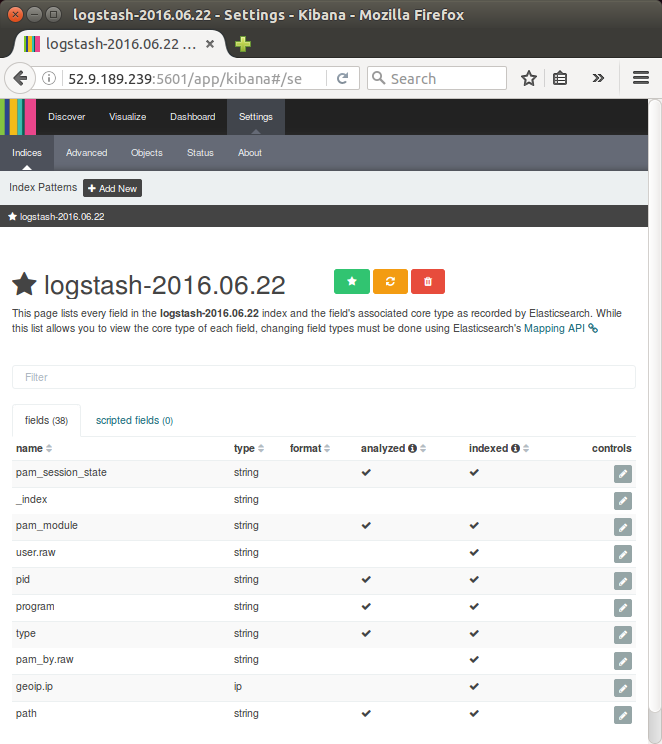
We're now ready to dive in to our data:
- Search and browse our data interactively from the Discover page.
- Chart and map our data from the Visualize page.
- Create and view custom dashboards from the Dashboard page.
There are wide range of agents we can use to ship logs from our nodes:
- Logstash itself
- Syslog (rsyslog, syslog-ng)
- logstash-forwarder
In this example, we'll use two nodes:
- 52.9.189.239 (172.31.4.244) : monitoring server
(Logstash indexer + Redis broker + Elasticsearch + Kibana) - 52.9.222.239 (172.31.3.54) : app
Logstash shipper
We'll use Redis as a broker between the shipper and the indexer.
As we already know, redis is often used as a buffer which queues Logstash events from remote Logstash so that we can use Logstash to ship them to Elasticsearch.
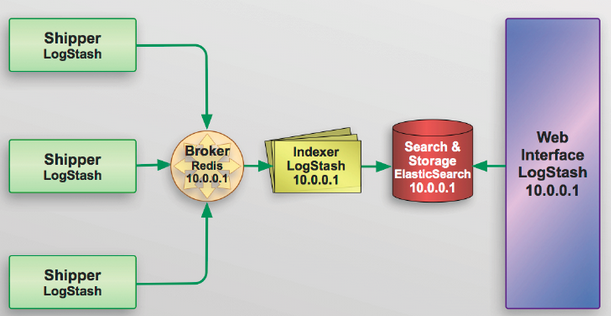
Picture credit : slideshare.net
Note: please ignore the ip in the picture above. It's not used in this tutorial.

Picture credit : Shipping and Indexing with Logstash.
We may replace the Logstash shipper with rsyslog which is pretty much all Linux boxes has and lighter compared with Logstash. So, in that setup, we can make rsyslog to push to Redis instead.
Monitoring Server:
We're going to use the version of Redis supplied with the package manager:
$ sudo apt-get install -y redis-server
Make sure that the Redis config (/etc/redis/redis.conf) has the following:
daemonize yes
pidfile /var/run/redis/redis-server.pid

loglevel notice
logfile /var/log/redis/redis-server.log

stop-writes-on-bgsave-error yes

rdbcompression yes
rdbchecksum yes
dbfilename dump.rdb

dir /var/lib/redis

port 6379
#bind 127.0.0.1 =>
bind 0.0.0.0
The last two lines make redis to listen on all interfaces on port 6379 (0.0.0.0:6379).
Restart the Redis with:
$ sudo service redis-server restart
Let's modify input portion of Logstash config file for the monitoring server so that redis can be used as the input:
input {
  redis {
    host => "localhost"
    key => "logstash"
    data_type => "list"
    codec => json
  }
}
Then, restart Logstash:
$ sudo service logstash restart
So far, we've been working on the monitoring server.
Let's move on to our shipper node which is another AWS instance running Logstash as one of the potential shippers.
Shipper node setting:
Install Logstash on the node we want to ship logs from.
This works just like on the indexer node.
We will read the same files we do on the indexer but we're going to ship them to the indexer.
So, we need to give Logstash permission to read these logs:
$ sudo apt-get install -y acl
$ sudo setfacl -m u:logstash:r /var/log/{syslog,auth.log}
Let's create /etc/logstash/conf.d/shipper.conf with the following (we need to specify hostnames for shipper and indexer):
input {
  file {
    type => "syslog"
    path => ["/var/log/auth.log", "/var/log/syslog"]
  }
}

filter {
  mutate {
    replace => ["host", "172.31.3.54"] # SHIPPER_HOSTNAME
  }
}

output {
  redis {
    host => "172.31.4.244:6379" # INDEXER_HOSTNAME
    data_type => "list"
    key => "logstash"
    codec => json
  }
}
The "mutate" will change current fields in the pipeline.
Restart shipper logstash:
$ sudo service logstash restart
Now on monitoring server, 52.9.189.239 (172.31.4.244), let's check if Redis got any from Logstash shipper on 52.9.222.239 (172.31.3.54) with the following command:
ubuntu@ip-172-31-4-244:$ curl 'http://localhost:9200/_search?pretty'
Yes, we got something(syslog) from AWS Logstash shipper instance:
    }, {
      "_index" : "logstash-2016.06.22",
      "_type" : "syslog",
      "_id" : "AVV7VnX23pvRvxOjeF7w",
      "_score" : 1.0,
      "_source" : {
        "message" : "Received disconnect from 121.18.238.32: 11:  [preauth]",
        "@version" : "1",
        "@timestamp" : "2016-06-22T11:44:32.000Z",
        "path" : "/var/log/auth.log",
        "host" : "172.31.3.54",
        "type" : "syslog",
        "logsource" : "ip-172-31-3-54",
        "program" : "sshd",
        "pid" : "3636"
      }
    } ]
  }
}
We've added Redis buffer queue to typical ELK stack.
We used two AWS instances: one for monitoring machine (Logstash indexer/Elasticsearch/Kibana) and the other instance for a sort of Logstash forwarder(shipper) to push syslog to Redis queue on our server.
As mentioned before, we could have used "rsyslog" for the shipper.
Also, we could use Lumberjack to prepare the indexer to receive logs utilizing the logstash-forwarder protocol.
As suggested in Logstash Improvements:
"If the monitoring server crashes, it takes everything with it. If it's down long enough, the shippers will start discarding their backlog to avoid filling up memory. To solve this, we will need to migrate the Redis instances to their own nodes."
"If we split Redis out of the monitoring node onto a couple other nodes, we get load balancing and high availability. If you have nodes across multiple datacenters, put a Redis instance in each datacenter. This provides tolerance in the event of a network partition."
Elastic Search, Logstash, Kibana
Elastic Stack docker/kubernetes series:
Ph.D. / Golden Gate Ave, San Francisco / Seoul National Univ / Carnegie Mellon / UC Berkeley / DevOps / Deep Learning / Visualization