ELK - Elasticsearch
Elastic Search, Logstash, Kibana
Elastic Stack docker/kubernetes series:
Elasticsearch is a search server based on Lucene (free open source information retrieval software library).
It's 'elastic' in the sense that it's easy to scale horizontally-simply add more nodes to distribute the load. Today, many companies, including Wikipedia, eBay, GitHub, and Datadog, use it to store, search, and analyze large amounts of data on the fly.
Elasticsearch represents data in the form of structured JSON documents, and makes full-text search accessible via RESTful API and web clients for languages like PHP, Python, and Ruby.
In Elasticsearch, related data is often stored in the same index, which can be thought of as the equivalent of a logical wrapper of configuration.
Each index contains a set of related documents in JSON format. Elasticsearch's secret sauce for full-text search is Lucene's inverted index.
When a document is indexed, Elasticsearch automatically creates an inverted index for each field; the inverted index maps terms to the documents that contain those terms as shown below:
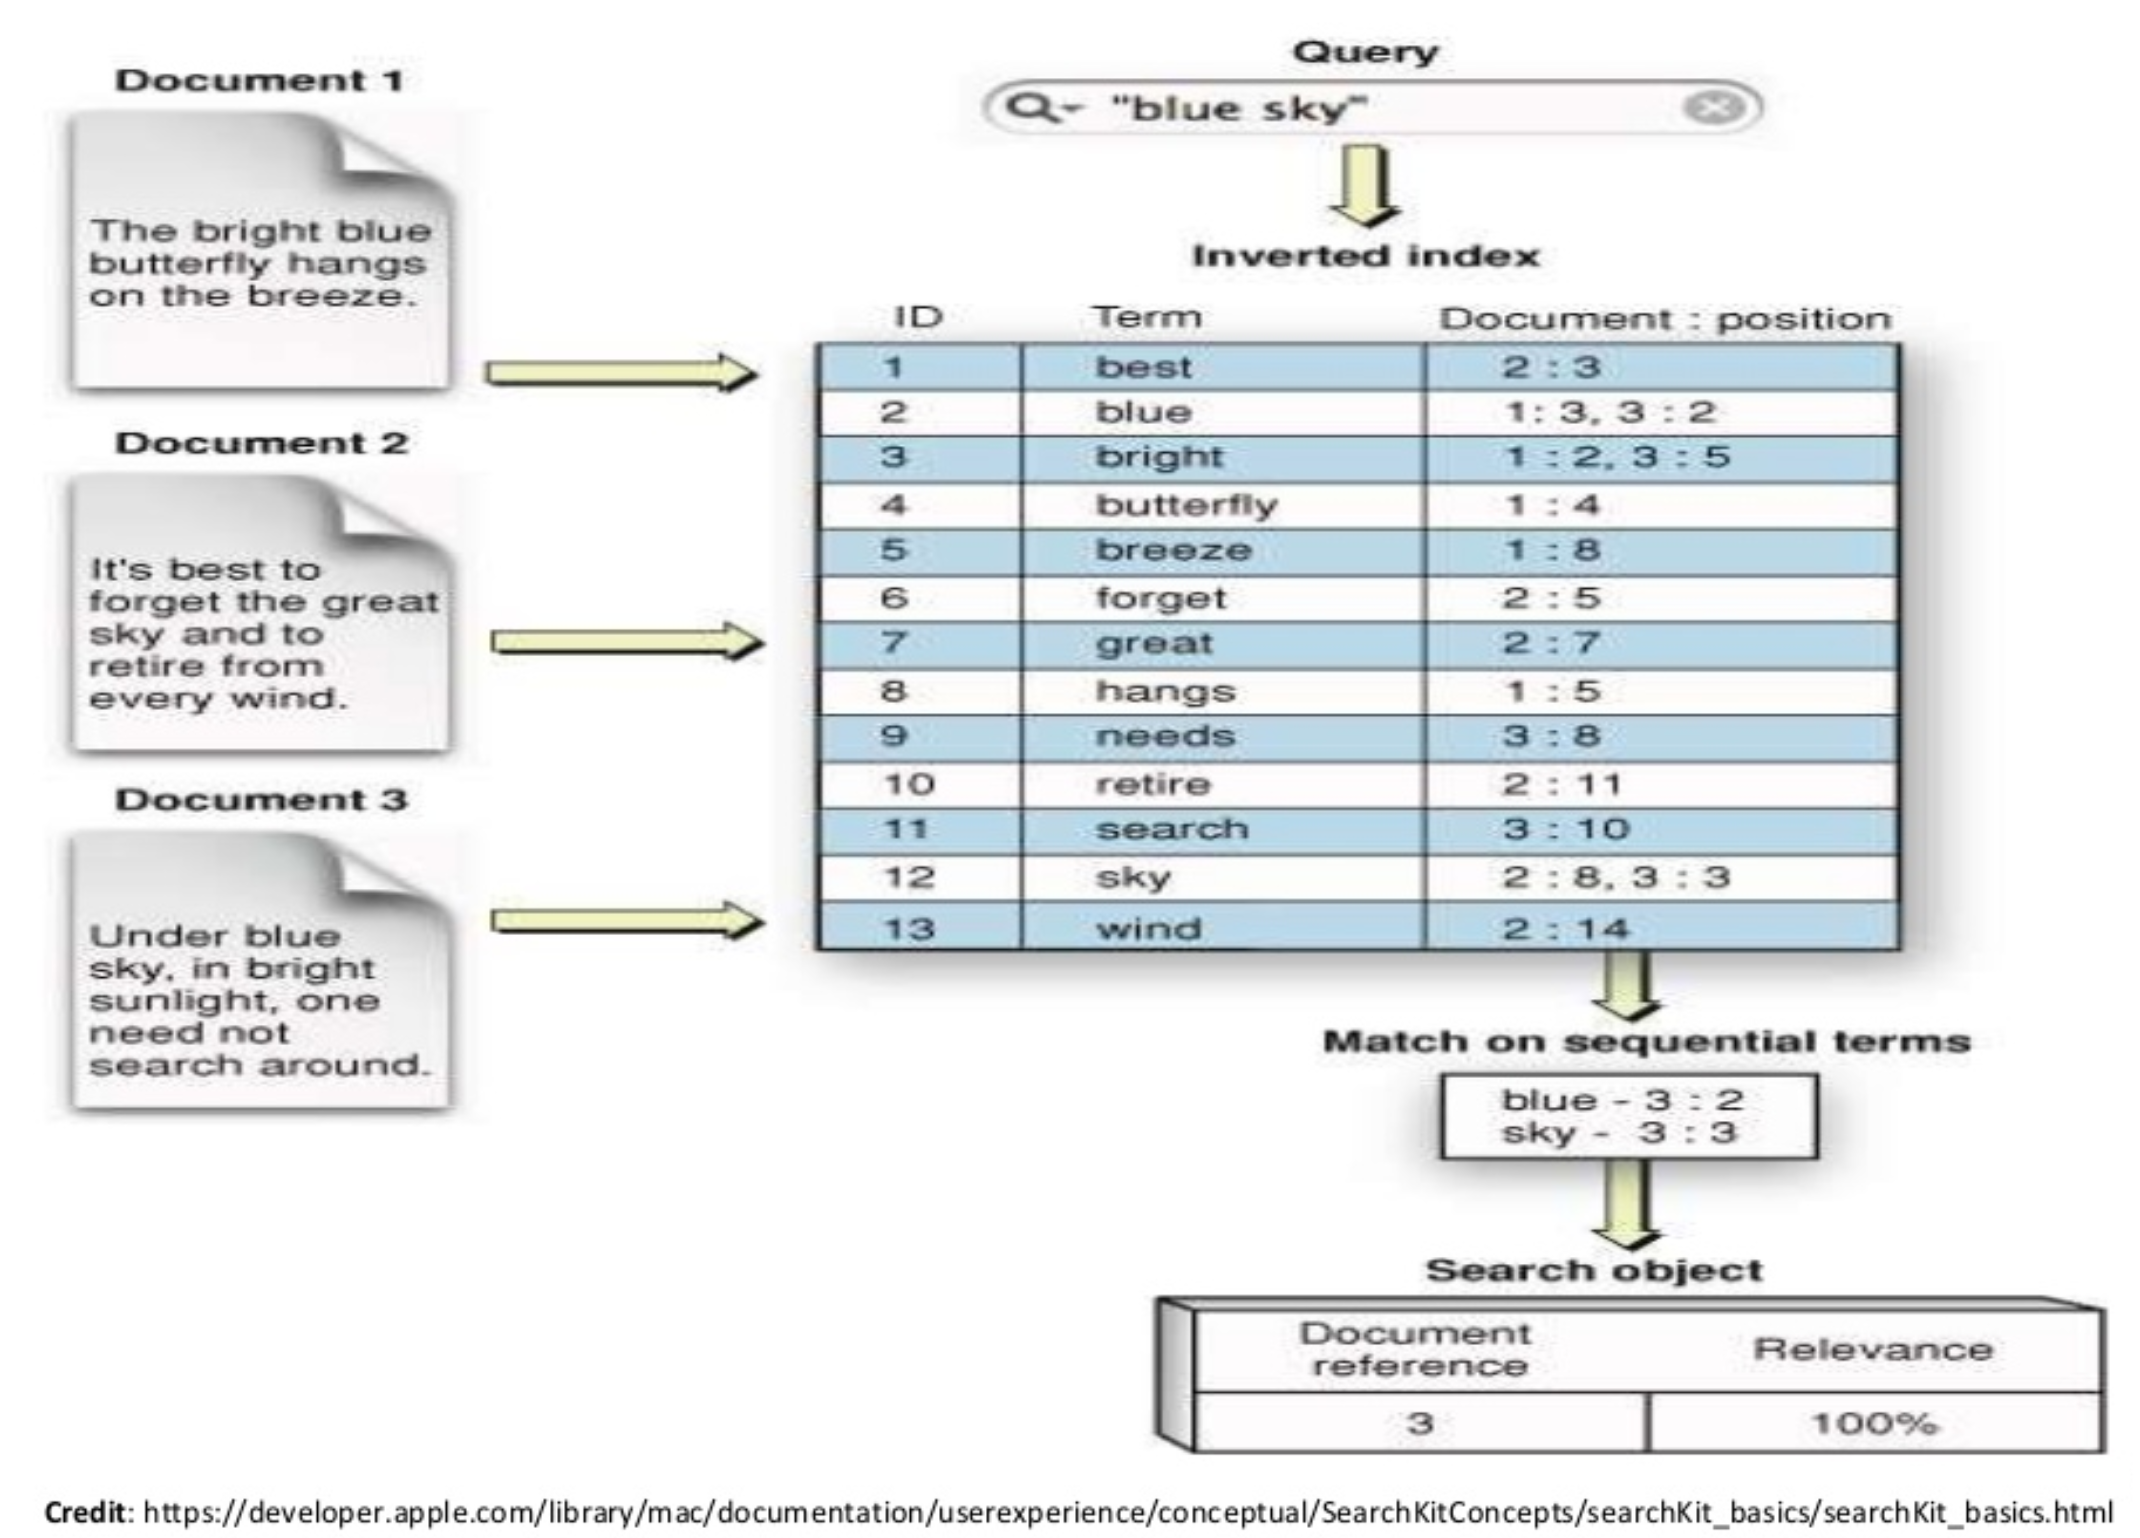
Elasticsearch is developed in Java and is released as open source. wiki
- Distributed and Scalable search engine.
- Based on Lucene.
- Hide Lucene complexity by exposing all services : HTTP/REST/JSON
- Horizontal scaling, replication, fail over, load balancing.
- Fast!
- It's a search engine NOT a search tool.
Note : Elasticsearch is a near real time search platform. What this means is there is a slight latency (normally one second) from the time we index a document until the time it becomes searchable.
This is an important distinction from other platforms like SQL wherein data is immediately available after a transaction is completed.
In Elasticsearch, a cluster is made up of one or more nodes, as shown below.
An index is stored across one or more primary shards, and zero or more replica shards, and each shard is a complete instance of Lucene, like a mini search engine.
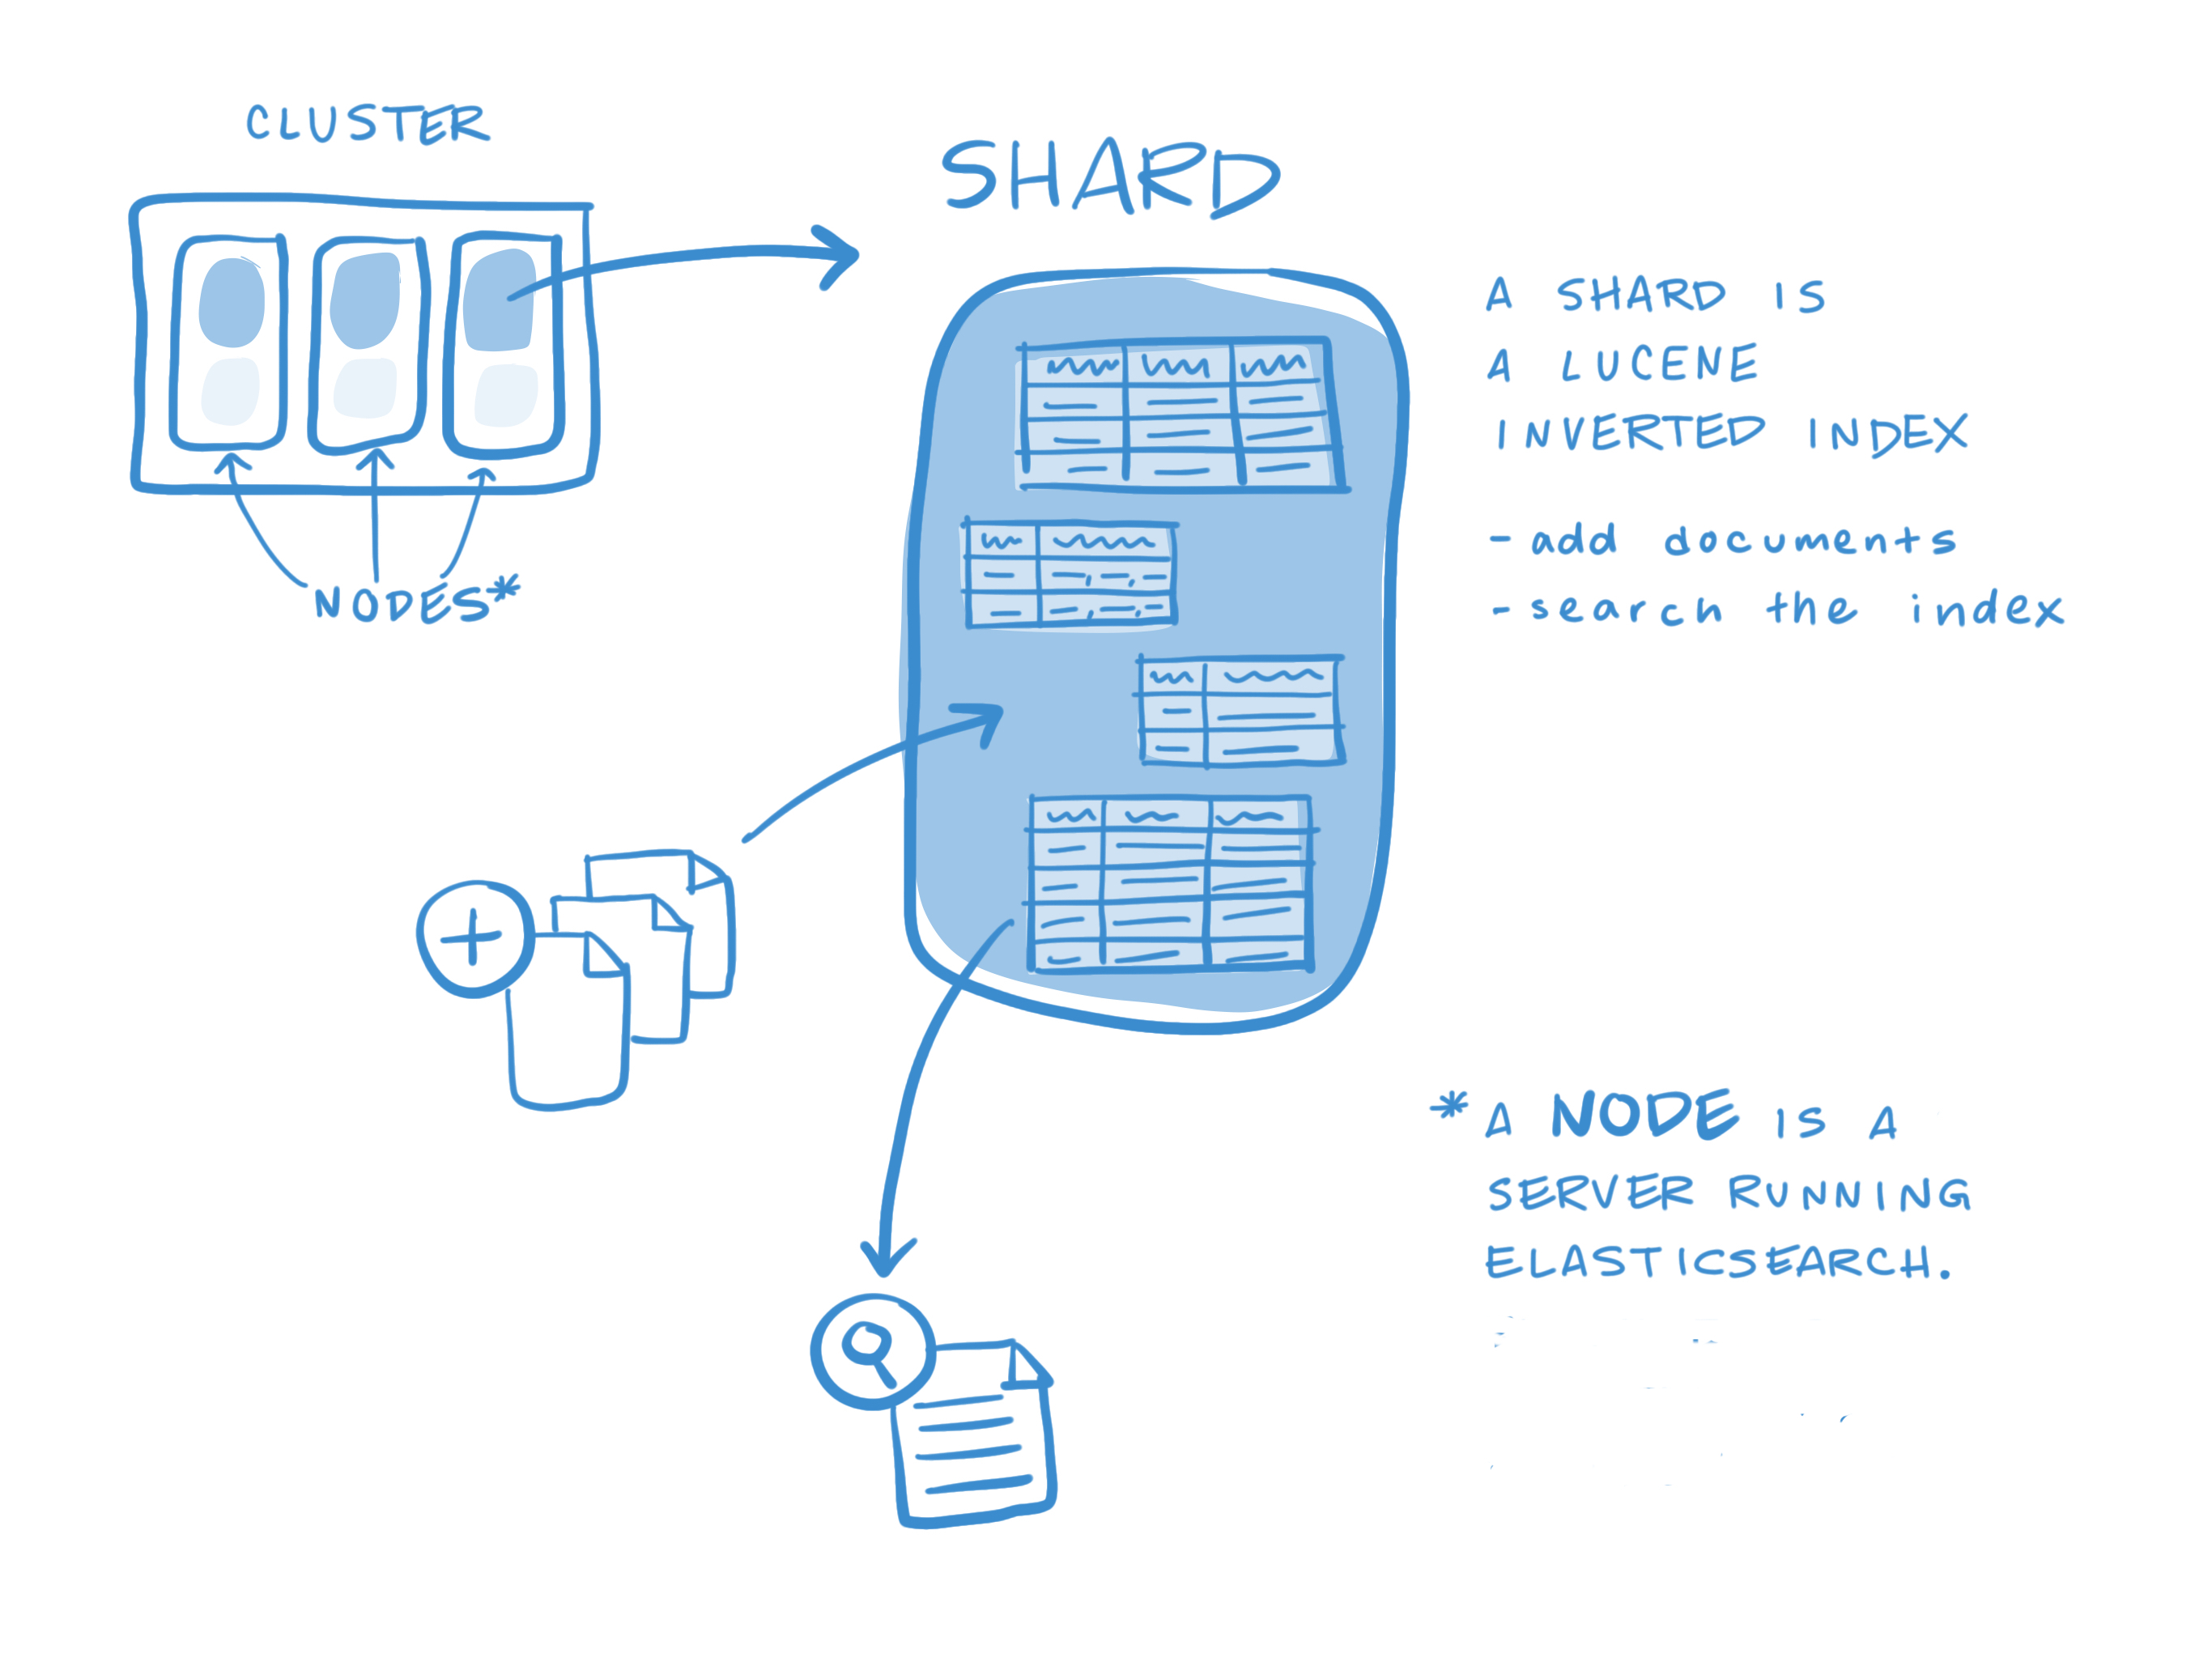
Other key concepts of Elasticsearch are replicas and shards, the mechanism Elasticsearch uses to distribute data around the cluster. The index is a logical namespace which maps to one or more primary shards and can have zero or more replica shards. A shard is a Lucene index and that an Elasticsearch index is a collection of shards. Our application talks to an index, and Elasticsearch routes our requests to the appropriate shards.
The smallest index we can have is one with a single shard. This setup may be small, but it may serve our current needs and is cheap to run. Suppose that our cluster consists of one node, and in our cluster we have one index, which has only one shard: an index with one primary shard and zero replica shards.
PUT /my_index
{
  "settings": {
    "number_of_shards":   1,
    "number_of_replicas": 0
  }
}
However, as time goes on, a single node just can't keep up with the traffic, and we decide to add a second node. What will happens? Nothing.
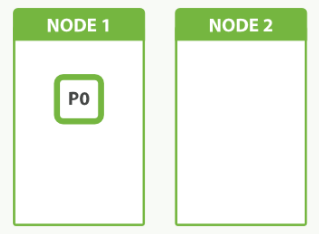
Because we have only one shard, there is nothing to put on the second node. We can't increase the number of shards in the index, because the number of shards is an important element in the algorithm used to route documents to shards:
shard = hash(routing) % number_of_primary_shards
We should have planned like this:
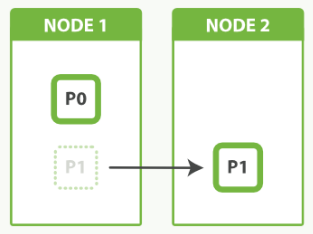
Our only option now is to reindex our data into a new, bigger index that has more shards, but that will take time that we can ill afford. By planning ahead, we could have avoided this problem completely by Shard Overallocation.
The main purpose of replicas is for failover: if the node holding a primary shard dies, a replica is promoted to the role of primary.
At index time, a replica shard does the same amount of work as the primary shard. New documents are first indexed on the primary and then on any replicas. Increasing the number of replicas does not change the capacity of the index.
However, replica shards can serve read requests. If, as is often the case, our index is search heavy, we can increase search performance by increasing the number of replicas, but only if we also add extra hardware.
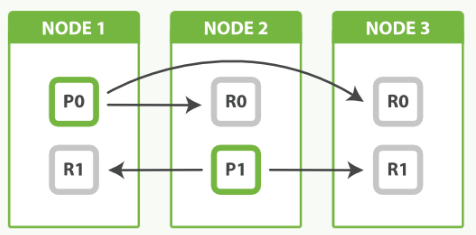
In the picture above, we have 3 nodes with 2 primary and 2 replicas. The fact that node 3 holds two replicas and no primaries is not important. Replicas and primaries do the same amount of work; they just play slightly different roles. There is no need to ensure that primaries are distributed evenly across all nodes.
Each node is a single running instance of Elasticsearch, and its configuration file (elasticsearch.yml) designates which cluster it belongs to (cluster.name) and what type of node it can be.
The diagram below shows that we constructed 1 dedicated master node and 5 data nodes.
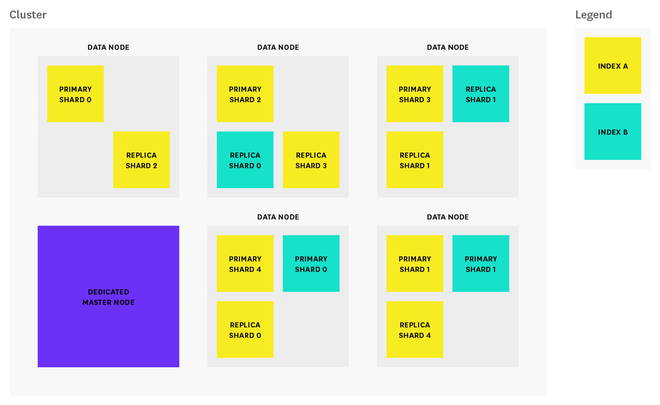
Credit : How to monitor Elasticsearch performance
Note: By default, each index in Elasticsearch is allocated 5 primary shards and 1 replica which means that if we have at least two nodes in our cluster, our index will have 5 primary shards and another 5 replica shards (1 complete replica) for a total of 10 shards per index.
The number of primary shards cannot be changed once an index has been created, so choose carefully, or we will likely need to reindex later on. The number of replicas can be updated later on as needed. To protect against data loss, the master node ensures that each replica shard is not allocated to the same node as its primary shard.
Elasticsearch has three types of nodes:
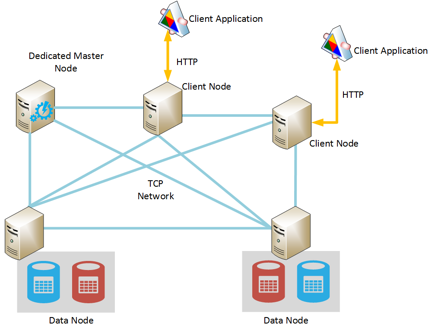
Credit : Run Elasticsearch on Azure
- Master-eligible nodes: By default, every node is master-eligible unless otherwise specified. Each cluster automatically elects a master node from all of the master-eligible nodes. In the event that the current master node experiences a failure (such as a power outage, hardware failure, or an out-of-memory error), master-eligible nodes elect a new master.
The master node is responsible for coordinating cluster tasks like distributing shards across nodes, and creating and deleting indices.
Any master-eligible node is also able to function as a data node. However, in larger clusters, users may launch dedicated master-eligible nodes that do not store any data (by adding node.data: false to the config file), in order to improve reliability.
In high-usage environments, moving the master role away from data nodes helps ensure that there will always be enough resources allocated to tasks that only master-eligible nodes can handle. - Data nodes: By default, every node is a data node that stores data in the form of shards (more about that in the section below) and performs actions related to indexing, searching, and aggregating data.
In larger clusters, we may choose to create dedicated data nodes by adding node.master: false to the config file, ensuring that these nodes have enough resources to handle data-related requests without the additional workload of cluster-related administrative tasks. - Client nodes: If we set node.master and node.data to false, we will end up with a client node, which is designed to act as a load balancer that helps route indexing and search requests.
Client nodes do not hold index data but that handle incoming requests made by client applications to the appropriate data node.
Client nodes help shoulder some of the search workload so that data and master-eligible nodes can focus on their core tasks. Depending on our use case, client nodes may not be necessary because data nodes are able to handle request routing on their own.
However, adding client nodes to our cluster makes sense if our search/index workload is heavy enough to benefit from having dedicated client nodes to help route requests.
In this section, we'll explore the process by which Elasticsearch updates an index.
When new information is added to an index, or existing information is updated or deleted, each shard in the index is updated via two processes: refresh and flush.
Index refresh
Newly indexed documents are not immediately made available for search.
First, they are written to an in-memory buffer where they await the next index refresh, which occurs once per second by default. The refresh process creates a new in-memory segment from the contents of the in-memory buffer (making the newly indexed documents searchable), then empties the buffer:
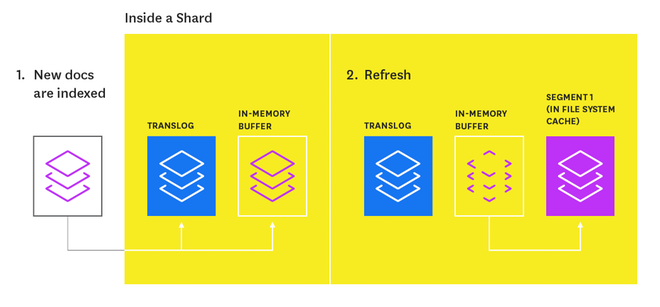
Shards of an index are composed of multiple segments. The core data structure from Lucene, a segment is essentially a change set for the index. These segments are created with every refresh and subsequently merged together over time in the background to ensure efficient use of resources.
Every time an index is searched, a primary or replica version of each shard must be searched by, in turn, searching every segment in that shard.
A segment is immutable, so updating a document means:
- writing the information to a new segment during the refresh process
- marking the old information as deleted
The old information is eventually deleted when the outdated segment is merged with another segment.
Index flush
At the same time that newly indexed documents are added to the in-memory buffer, they are also appended to the shard's translog: a persistent, write-ahead transaction log of operations. Every 30 minutes, or whenever the translog reaches a maximum size (by default, 512MB), a flush is triggered. During a flush, any documents in the in-memory buffer are refreshed (stored on new segments), all in-memory segments are committed to disk, and the translog is cleared.
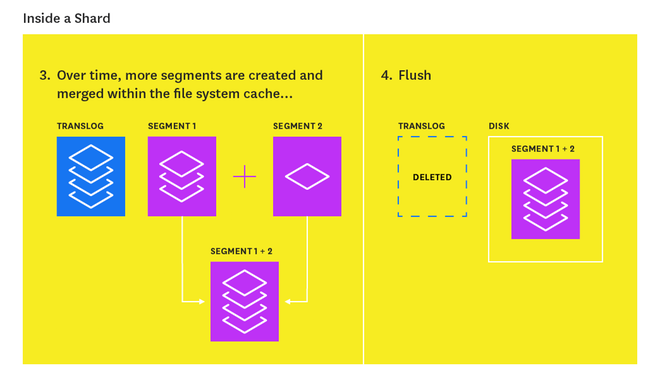
The translog helps prevent data loss in the event that a node fails. It is designed to help a shard recover operations that may otherwise have been lost between flushes. The log is committed to disk every 5 seconds, or upon each successful index, delete, update, or bulk request (whichever occurs first).
Here are a few sample use-cases of Elasticsearch from Getting Started.
- You run an online web store where you allow your customers to search for products that you sell. In this case, you can use Elasticsearch to store your entire product catalog and inventory and provide search and autocomplete suggestions for them.
- You want to collect log or transaction data and you want to analyze and mine this data to look for trends, statistics, summarizations, or anomalies. In this case, you can use Logstash (part of the Elasticsearch/Logstash/Kibana stack) to collect, aggregate, and parse your data, and then have Logstash feed this data into Elasticsearch. Once the data is in Elasticsearch, you can run searches and aggregations to mine any information that is of interest to you.
- You run a price alerting platform which allows price-savvy customers to specify a rule like "I am interested in buying a specific electronic gadget and I want to be notified if the price of gadget falls below $X from any vendor within the next month". In this case you can scrape vendor prices, push them into Elasticsearch and use its reverse-search (Percolator) capability to match price movements against customer queries and eventually push the alerts out to the customer once matches are found.
- You have analytics/business-intelligence needs and want to quickly investigate, analyze, visualize, and ask ad-hoc questions on a lot of data (think millions or billions of records). In this case, you can use Elasticsearch to store your data and then use Kibana (part of the Elasticsearch/Logstash/Kibana stack) to build custom dashboards that can visualize aspects of your data that are important to you. Additionally, you can use the Elasticsearch aggregations functionality to perform complex business intelligence queries against your data.
This video explains well about the internal workings of ES, especially, Lucene:
How to use ES?
The following video gives us a quick tour using Fiddler:
We need to install the JVM since Elasticsearch is written in Java.
Oracle or OpenJDK?
For Oracle Java:
$ sudo apt-get install software-properties-common
$ sudo add-apt-repository ppa:webupd8team/java
$ sudo apt-get update
$ sudo apt-get install oracle-java8-installer
$ java -version
java version "1.8.0_91"
Java(TM) SE Runtime Environment (build 1.8.0_91-b14)
Java HotSpot(TM) 64-Bit Server VM (build 25.91-b14, mixed mode)

$ readlink -f $(which javac)
/usr/lib/jvm/java-8-oracle/bin/javac
To set JAVA_HOME in .bashrc:
JAVA_HOME=/usr/lib/jvm/java-8-oracle
export JAVA_HOME
PATH=$JAVA_HOME/bin:$PATH
export PATH
OpenJDK:
$ sudo add-apt-repository ppa:openjdk-r/ppa
$ sudo apt-get update
$ sudo apt-get install openjdk-8-jdk
Run the following command to set the default Java:
$ sudo update-alternatives --config java
There are 2 choices for the alternative java (providing /usr/bin/java).

  Selection    Path                                            Priority   Status
------------------------------------------------------------
* 0            /usr/lib/jvm/java-8-openjdk-amd64/jre/bin/java   1069      auto mode
  1            /usr/lib/jvm/java-8-openjdk-amd64/jre/bin/java   1069      manual mode
  2            /usr/lib/jvm/java-8-oracle/jre/bin/java          2         manual mode

Press enter to keep the current choice[*], or type selection number:
If there is more than one Java versions installed on the system, type in a number to select a Java version. Set default Java Compiler by running the command:
$ sudo update-alternatives --config javac
There are 2 choices for the alternative javac (providing /usr/bin/javac).

  Selection    Path                                         Priority   Status
------------------------------------------------------------
* 0            /usr/lib/jvm/java-8-openjdk-amd64/bin/javac   1069      auto mode
  1            /usr/lib/jvm/java-8-openjdk-amd64/bin/javac   1069      manual mode
  2            /usr/lib/jvm/java-8-oracle/bin/javac          2         manual mode

Press enter to keep the current choice[*], or type selection number:
We'll use OpenJDK, so let's just press enter key:
$ java -version
openjdk version "1.8.0_91"
OpenJDK Runtime Environment (build 1.8.0_91-8u91-b14-0ubuntu4~14.04-b14)
OpenJDK 64-Bit Server VM (build 25.91-b14, mixed mode)
To download Elasticsearch on Debian system, visit Install Elasticsearch with Debian Package.
Download and install the package:
$ wget https://download.elastic.co/elasticsearch/release/org/elasticsearch/distribution/deb/elasticsearch/2.4.4/elasticsearch-2.4.4.deb
$ sudo dpkg -i elasticsearch-2.4.4.deb
Elasticsearch is installed in /usr/share/elasticsearch/ with its configuration files placed in /etc/elasticsearch/elasticsearch.yml and its init script added in /etc/init.d/elasticsearch.
Download and install the Public Signing Key:
$ wget -qO - https://packages.elastic.co/GPG-KEY-elasticsearch | sudo apt-key add -
To configure Elasticsearch to start automatically when the system boots up, run the following command:
$ sudo systemctl enable elasticsearch.service
Elasticsearch can be started and stopped as follows:
$ sudo systemctl start elasticsearch.service
$ sudo systemctl stop elasticsearch.service
To check the version, simply issue the following:
$ curl -XGET 'localhost:9200'
{
  "name" : "node-1",
  "cluster_name" : "my-application",
  "cluster_uuid" : "6XPhPhcNSxmloJbqYYIDmw",
  "version" : {
    "number" : "2.4.4",
    "build_hash" : "fcbb46dfd45562a9cf00c604b30849a6dec6b017",
    "build_timestamp" : "2017-01-03T11:33:16Z",
    "build_snapshot" : false,
    "lucene_version" : "5.5.2"
  },
  "tagline" : "You Know, for Search"
}
The Elasticsearch configuration files are in the /etc/elasticsearch directory:
- /etc/elasticsearch/elasticsearch.yml: Configures the Elasticsearch server settings. In this tutorial, we have only one node, we'll use the following configuration by just taking off the '#':
- logging.yml: Provides configuration for logging (/var/log/elasticsearch) by default.
cluster.name: cluster.name: my-application
node.name: node-1
The Debian package places config files, logs, and the data directory in the appropriate locations for a Debian-based system:
| Type | Description | Default Location | Setting |
|---|---|---|---|
home | Elasticsearch home directory or |
| |
bin | Binary scripts including |
| |
conf | Configuration files including |
|
|
conf | Environment variables including heap size, file descriptors. |
| |
data | The location of the data files of each index / shard allocated on the node. Can hold multiple locations. |
|
|
logs | Log files location. |
|
|
plugins | Plugin files location. Each plugin will be contained in a subdirectory. |
| |
repo | Shared file system repository locations. Can hold multiple locations. A file system repository can be placed in to any subdirectory of any directory specified here. | Not configured |
|
script | Location of script files. |
|
|
Elasticsearch is running on port 9200:
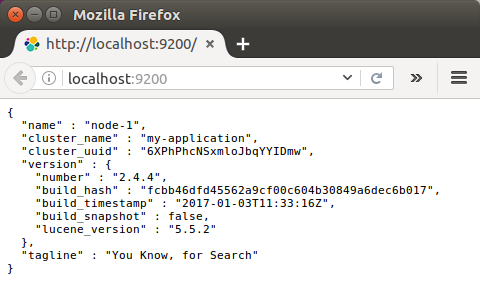
We can also test it with curl using a simple GET request like this:
$ curl -XGET 'localhost:9200/?pretty'
{
  "name" : "node-1",
  "cluster_name" : "my-application",
  "cluster_uuid" : "6XPhPhcNSxmloJbqYYIDmw",
  "version" : {
    "number" : "2.4.4",
    "build_hash" : "fcbb46dfd45562a9cf00c604b30849a6dec6b017",
    "build_timestamp" : "2017-01-03T11:33:16Z",
    "build_snapshot" : false,
    "lucene_version" : "5.5.2"
  },
  "tagline" : "You Know, for Search"
}
Elasticsearch is working properly!
To check the cluster health, we will be using the _cat API:
$ curl 'localhost:9200/_cat/health?v'
epoch      timestamp cluster        status node.total node.data shards pri relo init unassign pending_tasks max_task_wait_time active_shards_percent
1487031180 16:13:00  my-application yellow          1         1      5   5    0    0        5             0                  -                 50.0%
We can see that our cluster named "my-application" is up with a 'yellow' status.
Cluster status is reported as red if one or more primary shards (and its replicas) is missing, and yellow if one or more replica shards is missing. Normally, this happens when a node drops off the cluster for whatever reason (hardware failure, long garbage collection time, etc.). Once the node recovers, its shards will remain in an initializing state before they transition back to active status.
The number of initializing shards typically peaks when a node rejoins the cluster, and then drops back down as the shards transition into an active state.
During this initialization period, our cluster state may transition from green to yellow or red until the shards on the recovering node regain active status. In many cases, a brief status change to yellow or red may not require any action on our part.
However, if we notice that our cluster status is lingering in red or yellow state for an extended period of time, verify that the cluster is recognizing the correct number of Elasticsearch nodes.
We can also get a list of nodes in our cluster as follows:
$ curl 'localhost:9200/_cat/nodes?v'
host      ip        heap.percent ram.percent load node.role master name
127.0.0.1 127.0.0.1            4          95 0.60 d         *      node-1
Here, we can see our one node named "node-1", which is the single node that is currently in our cluster.
Now let's take a peek at our indices:
$ curl 'localhost:9200/_cat/indices?v'
health status index           pri rep docs.count docs.deleted store.size pri.store.size
yellow open   'localhost:9200   5   1          0            0       795b           795b
Once we have an instance of ElasticSearch up and running, we can talk to it using it's JSON based REST API residing at localhost port 9200.
We can use any HTTP client to talk to it.
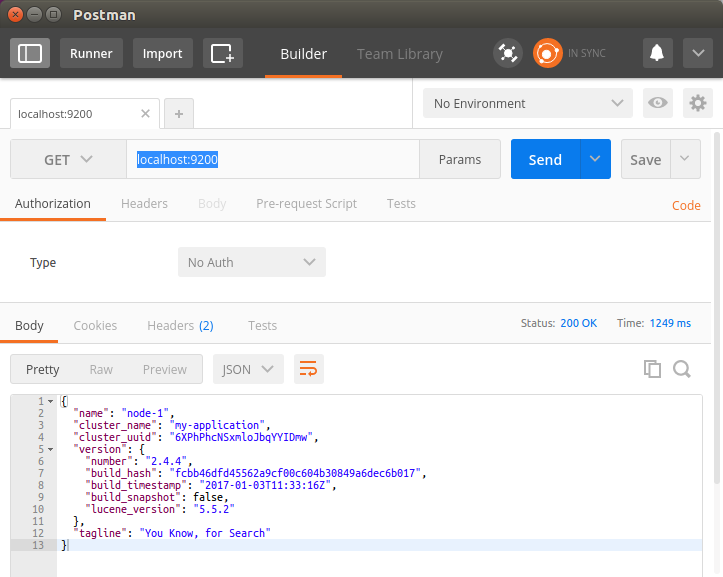
In ElasticSearch's own documentation all examples use curl, however, when playing with the API, we may find a UI client such as Fiddler, Sense, Postman or RESTClient.
Postman:
Sense Chrome plugin.
It is a handy console for interacting with the REST API of Elasticsearch. As we can see below, Sense is composed of two main panes. The left pane, named the editor, is where we type the requests we will submit to Elasticsearch. The responses from Elasticsearch are shown on the right hand panel. The address of our Elasticsearch server should be entered in the text box on the top of screen (and defaults to localhost:9200).
Sense understands commands in a cURL-like syntax. For example the following Sense command:
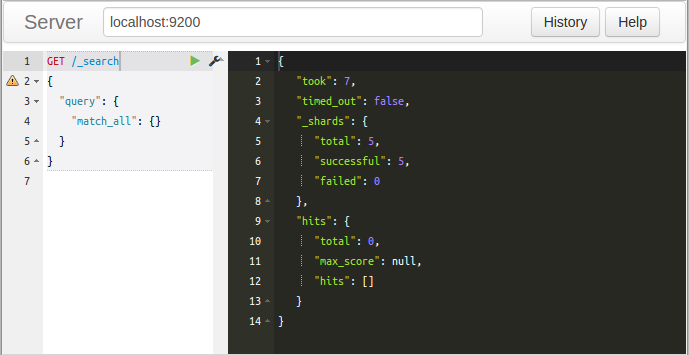
It is a simple GET request to Elasticsearc's _search API. Here is the equivalent command in cURL:
$ curl -XGET "http://localhost:9200/_search" -d'
{
  "query": {
    "match_all": {}
  }
}'
In fact, we can paste the above command into Sense and it will automatically be converted into the Sense syntax.
Note: since browsers do not support HTTP GET with a request body, we can simply execute the query using POST instead of GET:
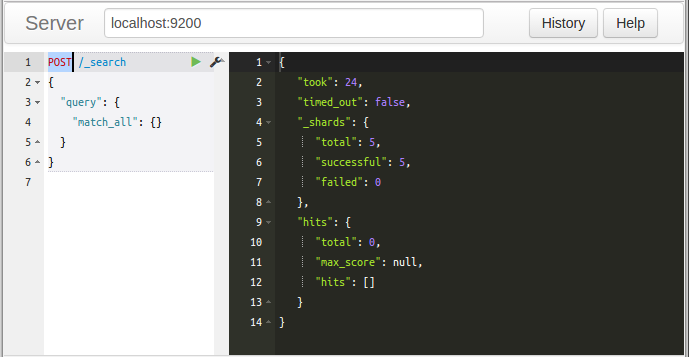
As shown in the previous section, Elasticsearch comes with a RESTful API that we'll be using to make our queries.
We're running Elasticsearch locally on localhost, we'll be using is http://localhost:9200/.
In Elasticsearch, the term document has a specific meaning. It refers to the top-level, or root object that is serialized into JSON and stored in Elasticsearch under a unique ID.
A document doesn't consist only of its data.
It also has metadata (information about the document). The three required metadata elements are as follows:
- _index: where the document lives
- _type: the class of object that the document represents
- _id: the unique identifier for the document
So, the query has the following components:
- Index
An index is the equivalent of database in relational database. The index is the top-most level that can be found athttp://mydomain.com:9200/<index>
- Types
Types are objects that are contained within indexes. They are like tables. Being a child of the index, they can be found athttp://mydomain.com:9200/<index>/<type>
- ID
In order to index a first JSON object, we make a PUT request to the REST API to a URL made up of the index name, type name and ID:
http://localhost:9200/<index>/<type>/[<id>]
Index and type are required while the id part is optional. If we don't specify an id, ElasticSearch will generate one for us. However, if we don't specify an id we should use POST instead of PUT.
Note that the following sections are based on the guide from Getting Started.
Now let's create an index named "customer" and then list all the indexes again:
$ curl -XPUT 'localhost:9200/customer?pretty'
{
  "acknowledged" : true
}

$ curl 'localhost:9200/_cat/indices?v'
health status index           pri rep docs.count docs.deleted store.size pri.store.size
yellow open   customer          5   1          0            0       650b           650b
The first command creates the index named "customer" using the PUT verb. We simply append pretty to the end of the call to tell it to pretty-print the JSON response (if any).
The results of the second command tells us that we now have 1 index named 'customer' and it has 5 primary shards and 1 replica (the defaults) and it contains 0 documents in it.
Notice that the customer index has a yellow health tagged to it, which means that some replicas are not (yet) allocated. The reason this happens for this index is because Elasticsearch by default created one replica for this index. Since we only have one node running at the moment, that one replica cannot yet be allocated (for high availability) until a later point in time when another node joins the cluster. Once that replica gets allocated onto a second node, the health status for this index will turn to green.
Now we want to put something into our customer index. In order to index a document, we must tell Elasticsearch which 'type' in the index it should go to.
Let's index a simple customer document into the customer index, "external" type, with an ID of 1 as follows:
Our JSON document: { "name": "John Doe" }
$ curl -XPUT 'localhost:9200/customer/external/1?pretty' -d '
{
  "name": "John Doe"
}'
The response looks like this:
{
  "_index" : "customer",
  "_type" : "external",
  "_id" : "1",
  "_version" : 1,
  "_shards" : {
    "total" : 2,
    "successful" : 1,
    "failed" : 0
  },
  "created" : true
}
A new customer document was successfully created inside the 'customer' index and the 'external' type. The document also has an internal id of 1 which we specified at index time.
It is important to note that Elasticsearch does not require us to explicitly create an index first before we can index documents into it. In the previous example, Elasticsearch will automatically create the customer index if it didn't already exist beforehand.
Let's query document that we've just indexed:
$ curl -XGET 'localhost:9200/customer/external/1?pretty'
{
  "_index" : "customer",
  "_type" : "external",
  "_id" : "1",
  "_version" : 1,
  "found" : true,
  "_source" : {
    "name" : "John Doe"
  }
}
Two fields are noticeable in the response:
- found, stating that we found a document with the requested ID 1
- _source, which returns the full JSON document that we indexed
Now let's delete the index that we just created:
$ curl -XDELETE 'localhost:9200/customer?pretty'
{
  "acknowledged" : true
}
Then list all the indexes again:
$ curl 'localhost:9200/_cat/indices?v'
health status index pri rep docs.count docs.deleted store.size pri.store.size
The response tells us that the index was deleted successfully and we are now back to where we started with nothing in our cluster.
We used couple of REST APIs to access Elasticsearch. The pattern looks like this:
curl -X<REST Verb> <Node>:<Port>/<Index>/<Type>/<ID>
This REST access pattern is pervasive throughout all the API commands that if we can simply remember it, you will have a good head start at mastering Elasticsearch!
In our previous section, we've indexed a single document like this:
$ curl -XPUT 'localhost:9200/customer/external/1?pretty' -d '
{
  "name": "John Doe"
}'
With the following response:
{
  "_index" : "customer",
  "_type" : "external",
  "_id" : "1",
  "_version" : 1,
  "_shards" : {
    "total" : 2,
    "successful" : 1,
    "failed" : 0
  },
  "created" : true
}
As we can see the response, we indexed the specified document into the customer index, external type, with the ID of 1.
If we then execute the above command again with a different (or same) document, Elasticsearch will replace (i.e. reindex) a new document on top of the existing one with the ID of 1:
$ curl -XPUT 'localhost:9200/customer/external/1?pretty' -d '
{
  "name": "Jane Doe"
}'
The above changes the name of the document with the ID of 1 from "John Doe" to "Jane Doe".
However, if we use a different ID, a new document will be indexed and the existing document(s) already in the index remains untouched:
$ curl -XPUT 'localhost:9200/customer/external/2?pretty' -d '
{
  "name": "Jane Doe"
}'
The above command indexes a new document with an ID of 2.
When indexing, the ID part is optional. If not specified, Elasticsearch will generate a random ID and then use it to index the document. The actual ID Elasticsearch generates (or whatever we specified explicitly in the previous examples) is returned as part of the index API call.
The following example shows how to index a document without an explicit ID:
$ curl -XPOST 'localhost:9200/customer/external?pretty' -d '
{
  "name": "Jane Doe"
}'
Note that in the above case, we are using the POST verb instead of PUT since we didn't specify an ID, and indeed we have two documents now:
$ curl 'localhost:9200/_cat/indices?v'
health status index    pri rep docs.count docs.deleted store.size pri.store.size
yellow open   customer   5   1          2            0      6.6kb          6.6kb
To query:
$ curl -XGET 'localhost:9200/_search?pretty'
{
  "took" : 48,
  "timed_out" : false,
  "_shards" : {
    "total" : 5,
    "successful" : 5,
    "failed" : 0
  },
  "hits" : {
    "total" : 2,
    "max_score" : 1.0,
    "hits" : [ {
      "_index" : "customer",
      "_type" : "external",
      "_id" : "2",
      "_score" : 1.0,
      "_source" : {
        "name" : "Jane Doe"
      }
    }, {
      "_index" : "customer",
      "_type" : "external",
      "_id" : "1",
      "_score" : 1.0,
      "_source" : {
        "name" : "John Doe"
      }
    } ]
  }
}
Note that we can drop the '-XGET' from the query.
The same query in Sense UI:
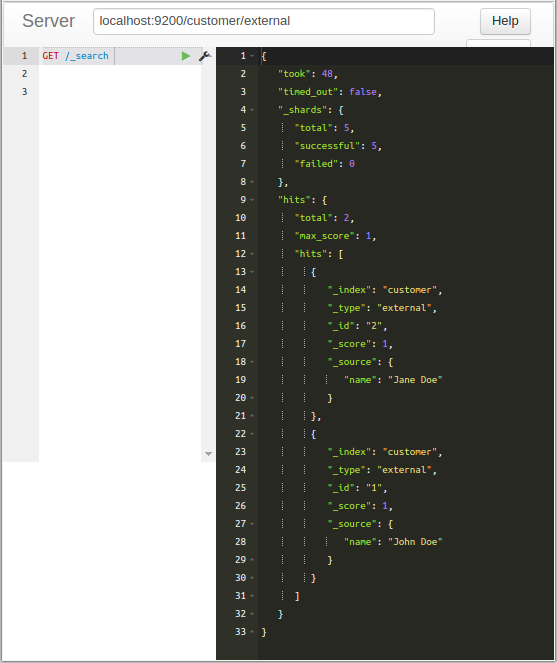
The queries above are equivalent to the following:
$ curl localhost:9200/_search?pretty -d '
{
    "query" : {
        "match_all" : {}
    }
}'
Response:
{
  "took" : 101,
  "timed_out" : false,
  "_shards" : {
    "total" : 5,
    "successful" : 5,
    "failed" : 0
  },
  "hits" : {
    "total" : 2,
    "max_score" : 1.0,
    "hits" : [ {
      "_index" : "customer",
      "_type" : "external",
      "_id" : "2",
      "_score" : 1.0,
      "_source" : {
        "name" : "Jane Doe"
      }
    }, {
      "_index" : "customer",
      "_type" : "external",
      "_id" : "1",
      "_score" : 1.0,
      "_source" : {
        "name" : "John Doe"
      }
    } ]
  }
}
Note that to query all, we may use this as well:
$ curl -XPOST http://localhost:9200/customer/external/_search?pretty -d '{"query": {"match_all": {}}}'
In addition to being able to index and replace documents, we can also update documents.
However, note that Elasticsearch does not actually do in-place updates under the hood. Whenever we do an update, Elasticsearch deletes the old document and then indexes a new document with the update applied to it in one shot.
The example below shows how to update our previous document (ID of 2) by changing the name field to "Jane Doo":
$ curl -XPOST 'localhost:9200/customer/external/2/_update?pretty' -d '
{
  "doc": { "name": "Jane Doo" }
}'
Response:
{
  "_index" : "customer",
  "_type" : "external",
  "_id" : "2",
  "_version" : 2,
  "_shards" : {
    "total" : 2,
    "successful" : 1,
    "failed" : 0
  }
}
Let's check what we've done:
$ curl localhost:9200/_search?pretty -d '
{
    "query" : {
        "match_all" : {}
    }
}'
{
  "took" : 88,
  "timed_out" : false,
  "_shards" : {
    "total" : 5,
    "successful" : 5,
    "failed" : 0
  },
  "hits" : {
    "total" : 2,
    "max_score" : 1.0,
    "hits" : [ {
      "_index" : "customer",
      "_type" : "external",
      "_id" : "2",
      "_score" : 1.0,
      "_source" : {
        "name" : "Jane Doo"
      }
    }, {
      "_index" : "customer",
      "_type" : "external",
      "_id" : "1",
      "_score" : 1.0,
      "_source" : {
        "name" : "John Doe"
      }
    } ]
  }
}
Now we may want to switch it back to the correct name and at the same time add an 'age' field to it using the following command:
$ curl -XPOST 'localhost:9200/customer/external/2/_update?pretty' -d '
{
  "doc": { "name": "Jane Doe", "age": 18 }
}'
Let's check it:
$ curl localhost:9200/_search?pretty
The response:
{
  "took" : 38,
  "timed_out" : false,
  "_shards" : {
    "total" : 5,
    "successful" : 5,
    "failed" : 0
  },
  "hits" : {
    "total" : 2,
    "max_score" : 1.0,
    "hits" : [ {
      "_index" : "customer",
      "_type" : "external",
      "_id" : "2",
      "_score" : 1.0,
      "_source" : {
        "name" : "Jane Doe",
        "age" : 18
      }
    }, {
      "_index" : "customer",
      "_type" : "external",
      "_id" : "1",
      "_score" : 1.0,
      "_source" : {
        "name" : "John Doe"
      }
    } ]
  }
}
Deleting a document is fairly straightforward. This example shows how to delete our previous customer with the ID of 2:
$ curl -XDELETE 'localhost:9200/customer/external/2?pretty'
Check if it is really been deleted:
$ curl localhost:9200/_search?pretty
{
  "took" : 16,
  "timed_out" : false,
  "_shards" : {
    "total" : 5,
    "successful" : 5,
    "failed" : 0
  },
  "hits" : {
    "total" : 1,
    "max_score" : 1.0,
    "hits" : [ {
      "_index" : "customer",
      "_type" : "external",
      "_id" : "1",
      "_score" : 1.0,
      "_source" : {
        "name" : "John Doe"
      }
    } ]
  }
}
Yes, we can see ID=2 has been deleted!
In addition to being able to index, update, and delete individual documents, Elasticsearch also provides the ability to perform any of the above operations in batches using the _bulk API.
This functionality is important in that it provides a very efficient mechanism to do multiple operations as fast as possible with as little network round trips as possible.
As a quick example, the following call indexes two documents (ID 2 - John Doe and ID 1 - Jane Doe) in one bulk operation:
$ curl -XPOST 'localhost:9200/customer/external/_bulk?pretty' -d '
{"index":{"_id":"2"}}
{"name": "John Doe" }
{"index":{"_id":"1"}}
{"name": "Jane Doe" }
'
Let's see we have the two:
$ curl localhost:9200/_search?pretty
{
  "took" : 14,
  "timed_out" : false,
  "_shards" : {
    "total" : 5,
    "successful" : 5,
    "failed" : 0
  },
  "hits" : {
    "total" : 2,
    "max_score" : 1.0,
    "hits" : [ {
      "_index" : "customer",
      "_type" : "external",
      "_id" : "2",
      "_score" : 1.0,
      "_source" : {
        "name" : "John Doe"
      }
    }, {
      "_index" : "customer",
      "_type" : "external",
      "_id" : "1",
      "_score" : 1.0,
      "_source" : {
        "name" : "Jane Doe"
      }
    } ]
  }
}
This example updates the first document (ID of 1) and then deletes the second document (ID of 2) in one bulk operation:
$ curl -XPOST 'localhost:9200/customer/external/_bulk?pretty' -d '
{"update":{"_id":"1"}}
{"doc": { "name": "Jane Doe becomes John Doe" } }
{"delete":{"_id":"2"}}
'
Here is the result:
$ curl localhost:9200/_search?pretty
{
  "took" : 6,
  "timed_out" : false,
  "_shards" : {
    "total" : 5,
    "successful" : 5,
    "failed" : 0
  },
  "hits" : {
    "total" : 1,
    "max_score" : 1.0,
    "hits" : [ {
      "_index" : "customer",
      "_type" : "external",
      "_id" : "1",
      "_score" : 1.0,
      "_source" : {
        "name" : "Jane Doe becomes John Doe"
      }
    } ]
  }
}
The bulk API executes all the actions sequentially and in order. If a single action fails for whatever reason, it will continue to process the remainder of the actions after it. When the bulk API returns, it will provide a status for each action (in the same order it was sent in) so that we can check if a specific action failed or not.
We should monitor query latency and take action if it surpasses a threshold. It's important to monitor relevant metrics about queries and fetches that can help us determine how our searches perform over time.
For example, we may want to track spikes and long-term increases in query requests, so that we can be prepared to tweak our configuration to optimize for better performance and reliability.
| Metric description | Name |
|---|---|
| Total number of queries | indices.search.query_total |
| Total time spent on queries | indices.search.query_current |
| Total number of fetches | indices.search.fetch_total |
| Total time spent on fetches | indices.search.fetch_time_in_millis |
| Number of fetches currently in progress | indices.search.fetch_current |
| Total number of documents indexed | indices.indexing.index_total |
| Total time spent indexing documents | indices.indexing.index_time_in_millis |
| Number of documents currently being indexed | indices.indexing.index_current |
| Total number of index refreshes | indices.refresh.total |
| Total time spent refreshing indices | indices.refresh.total_time_in_millis |
| Total number of index flushes to disk | indices.flush.total |
| Total time spent on flushing indices to disk | indices.flush.total_time_in_millis |
| Total count of young-generation garbage collections | jvm.gc.collectors.young.collection_count (jvm.gc.collectors.ParNew.collection_count prior to vers. 0.90.10) |
| Total time spent on young-generation garbage collections | jvm.gc.collectors.young.collection_time_in_millis (jvm.gc.collectors.ParNew.collection_time_in_millis prior to vers. 0.90.10) |
| Total count of old-generation garbage collections | jvm.gc.collectors.old.collection_count (jvm.gc.collectors.ConcurrentMarkSweep.collection_count prior to vers. 0.90.10) |
| Total time spent on old-generation garbage collections | jvm.gc.collectors.old.collection_time_in_millis (jvm.gc.collectors.ConcurrentMarkSweep.collection_time_in_millis prior to vers. 0.90.10) |
| Percent of JVM heap currently in use | jvm.mem.heap_used_percent |
| Amount of JVM heap committed | jvm.mem.heap_committed_in_bytes |
Elasticsearch relies on garbage collection processes to free up heap memory. Because garbage collection uses resources, we should keep an eye on its frequency and duration to see if we need to adjust the heap size. Setting the heap too large can result in long garbage collection times; these excessive pauses are dangerous because they can lead our cluster to mistakenly register our node as having dropped off the grid.
Refs:
Elastic Search, Logstash, Kibana
Elastic Stack docker/kubernetes series:
Ph.D. / Golden Gate Ave, San Francisco / Seoul National Univ / Carnegie Mellon / UC Berkeley / DevOps / Deep Learning / Visualization