Docker - ELK 7.6 : Kibana Part 1

Elastic Stack docker/kubernetes series:
Kibana is available as Docker images. The images use centos:7 as the base image.
A list of all published Docker images and tags is available at www.docker.elastic.co.
Issue a docker pull command against the Elastic Docker registry:
$ docker pull docker.elastic.co/kibana/kibana:7.6.2
Kibana can be quickly started and connected to a local Elasticsearch container for development or testing use with the following command:
$ docker ps
CONTAINER ID        IMAGE                                                 COMMAND                  CREATED             STATUS              PORTS                                            NAMES
e49fee1e070a        docker.elastic.co/logstash/logstash:7.6.2             "/usr/local/bin/dock…"   12 minutes ago      Up 12 minutes                                                        friendly_antonelli
addeb5426f0a        docker.elastic.co/beats/filebeat:7.6.2                "/usr/local/bin/dock…"   11 hours ago        Up 11 hours                                                          filebeat
caa1097bc4af        docker.elastic.co/elasticsearch/elasticsearch:7.6.2   "/usr/local/bin/dock…"   2 days ago          Up 2 days           0.0.0.0:9200->9200/tcp, 0.0.0.0:9300->9300/tcp   nifty_mayer

$ docker run --link caa1097bc4af:elasticsearch -p 5601:5601 docker.elastic.co/kibana/kibana:7.6.2
...
{"type":"log","@timestamp":"2020-03-31T16:33:14Z","tags":["listening","info"],"pid":6,"message":"Server running at http://0:5601"}
{"type":"log","@timestamp":"2020-03-31T16:33:14Z","tags":["info","http","server","Kibana"],"pid":6,"message":"http server running at http://0:5601"}


$ docker ps
CONTAINER ID        IMAGE                                                 COMMAND                  CREATED             STATUS              PORTS                                            NAMES
620c39470d7f        docker.elastic.co/kibana/kibana:7.6.2                 "/usr/local/bin/dumb…"   2 hours ago         Up 2 hours          0.0.0.0:5601->5601/tcp                           dazzling_chatterjee
e49fee1e070a        docker.elastic.co/logstash/logstash:7.6.2             "/usr/local/bin/dock…"   3 hours ago         Up 3 hours                                                           friendly_antonelli
addeb5426f0a        docker.elastic.co/beats/filebeat:7.6.2                "/usr/local/bin/dock…"   14 hours ago        Up 14 hours                                                          filebeat
caa1097bc4af        docker.elastic.co/elasticsearch/elasticsearch:7.6.2   "/usr/local/bin/dock…"   2 days ago          Up 2 days           0.0.0.0:9200->9200/tcp, 0.0.0.0:9300->9300/tcp   nifty_mayer
Kibana is a web application that we can access through port 5601. All we need to do is point our web browser at the machine where Kibana is running and specify the port number. For example, localhost:5601 or http://YOURDOMAIN.com:5601. If we want to allow remote users to connect, set the parameter server.host in kibana.yml to a non-loopback address.
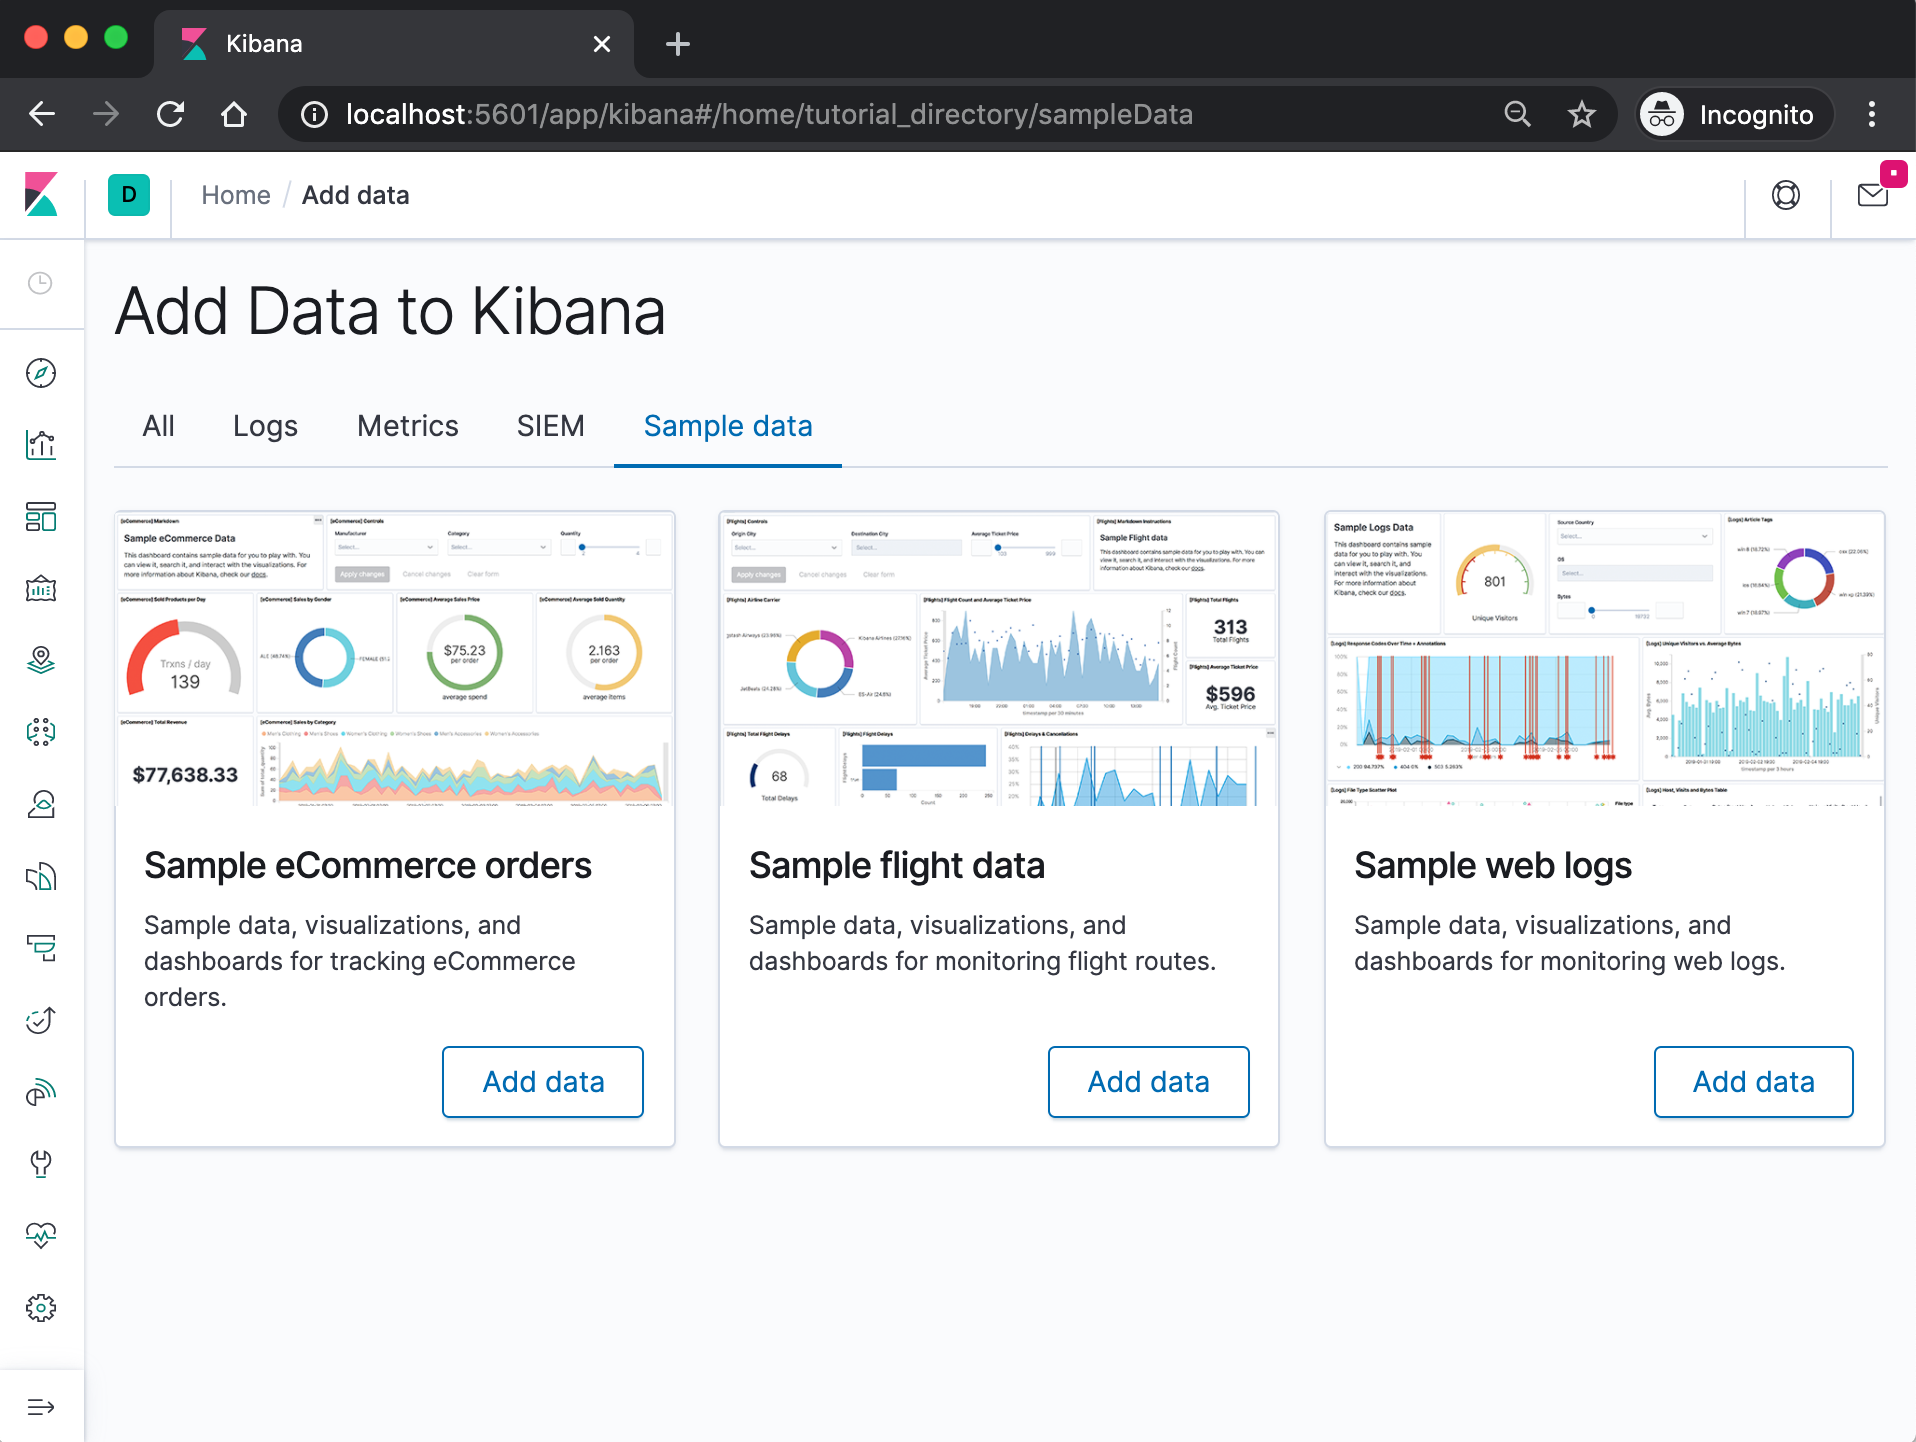
When we access Kibana, the Discover page loads by default with the default index pattern selected. The time filter is set to the last 15 minutes and the search query is set to match-all (\*).
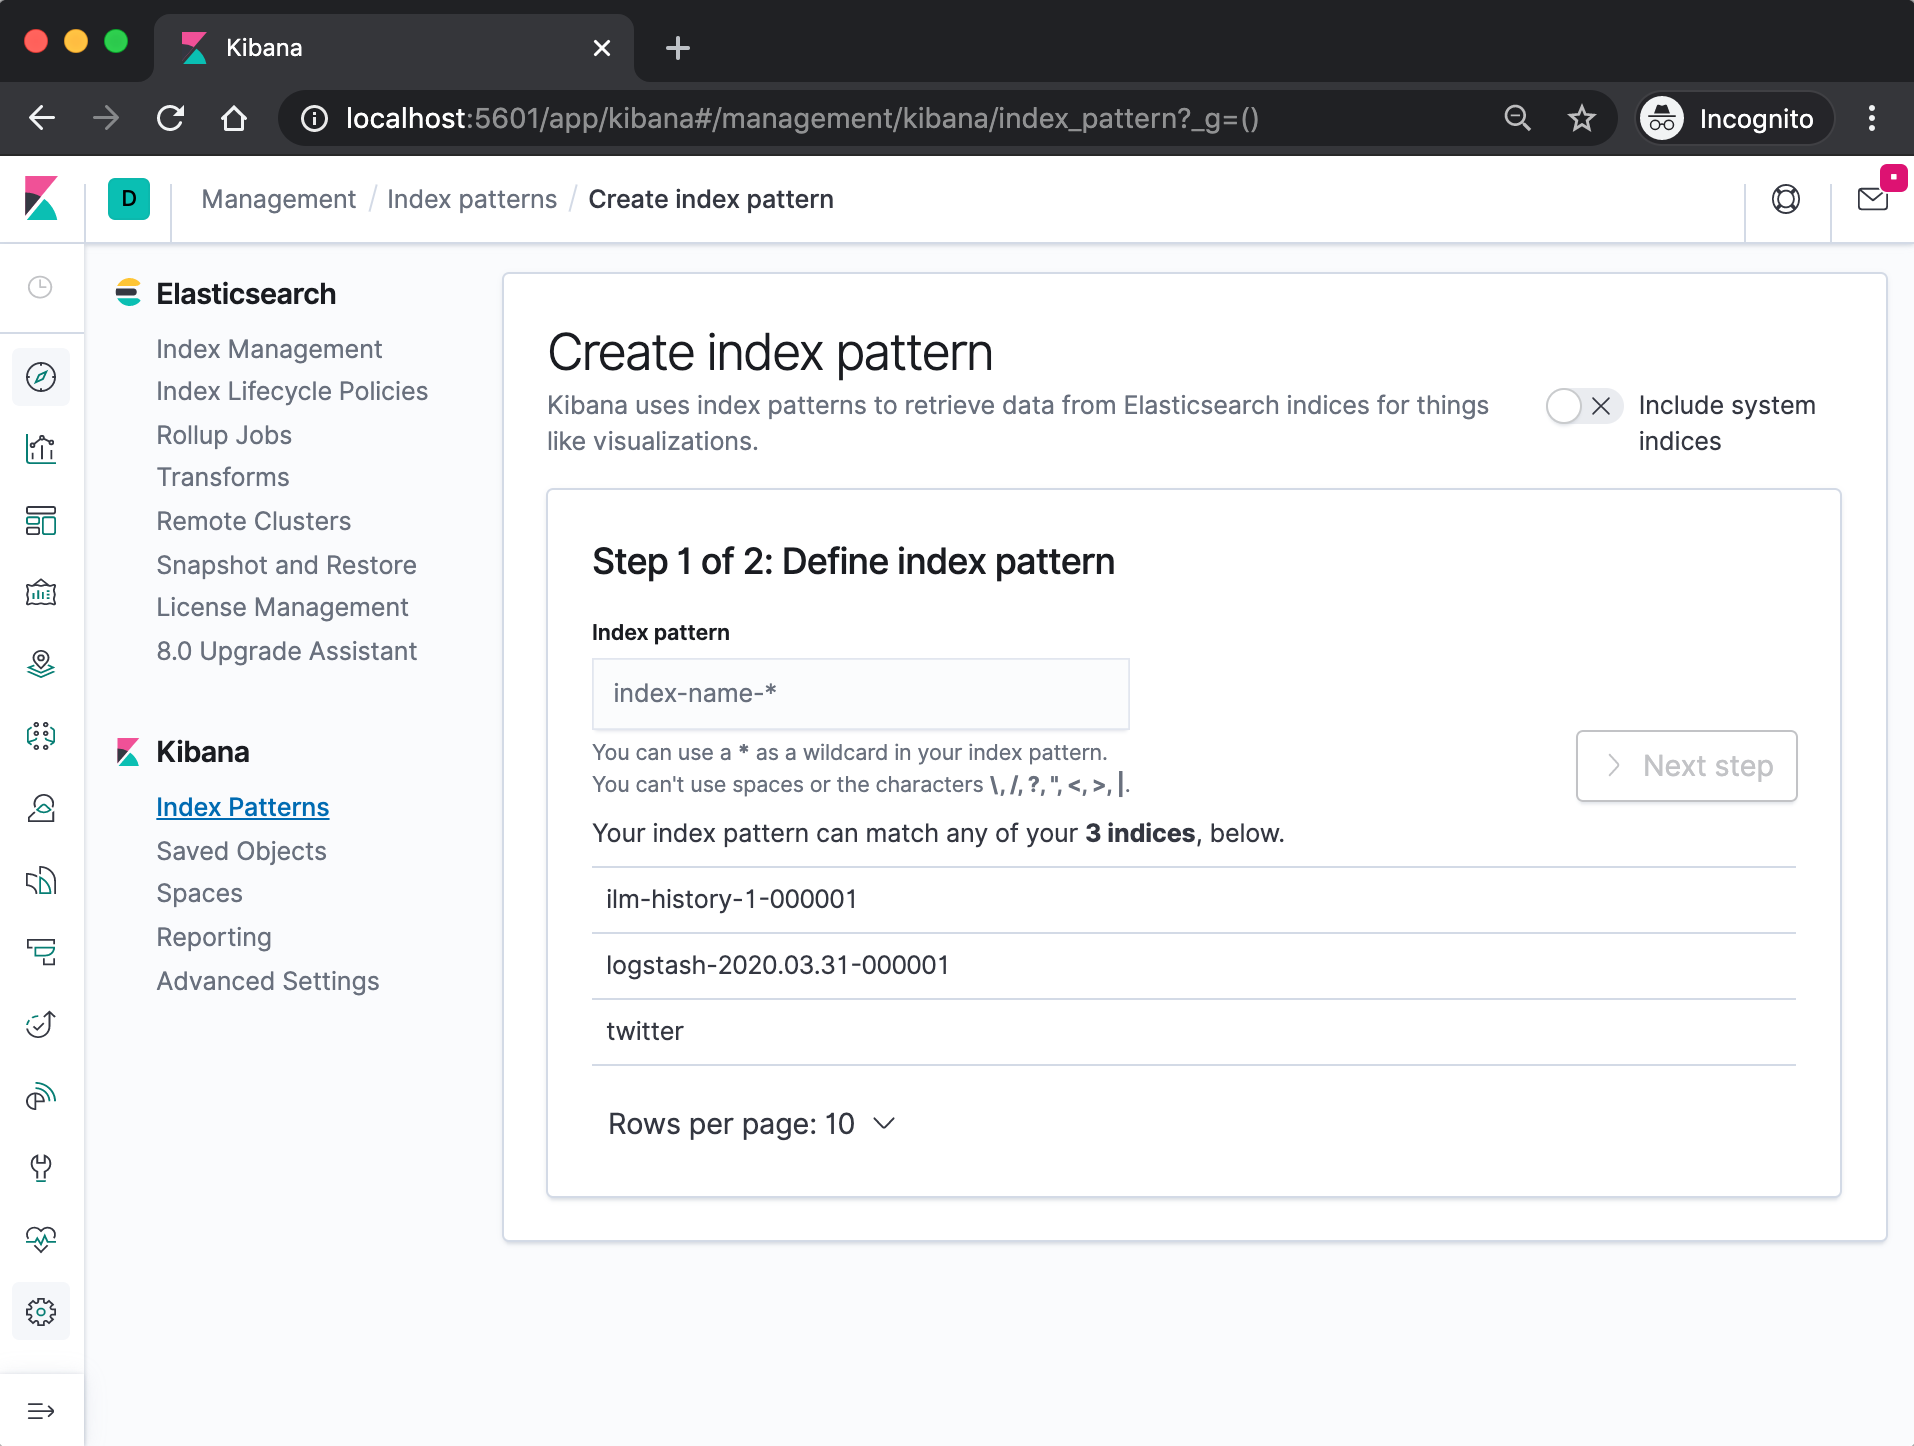
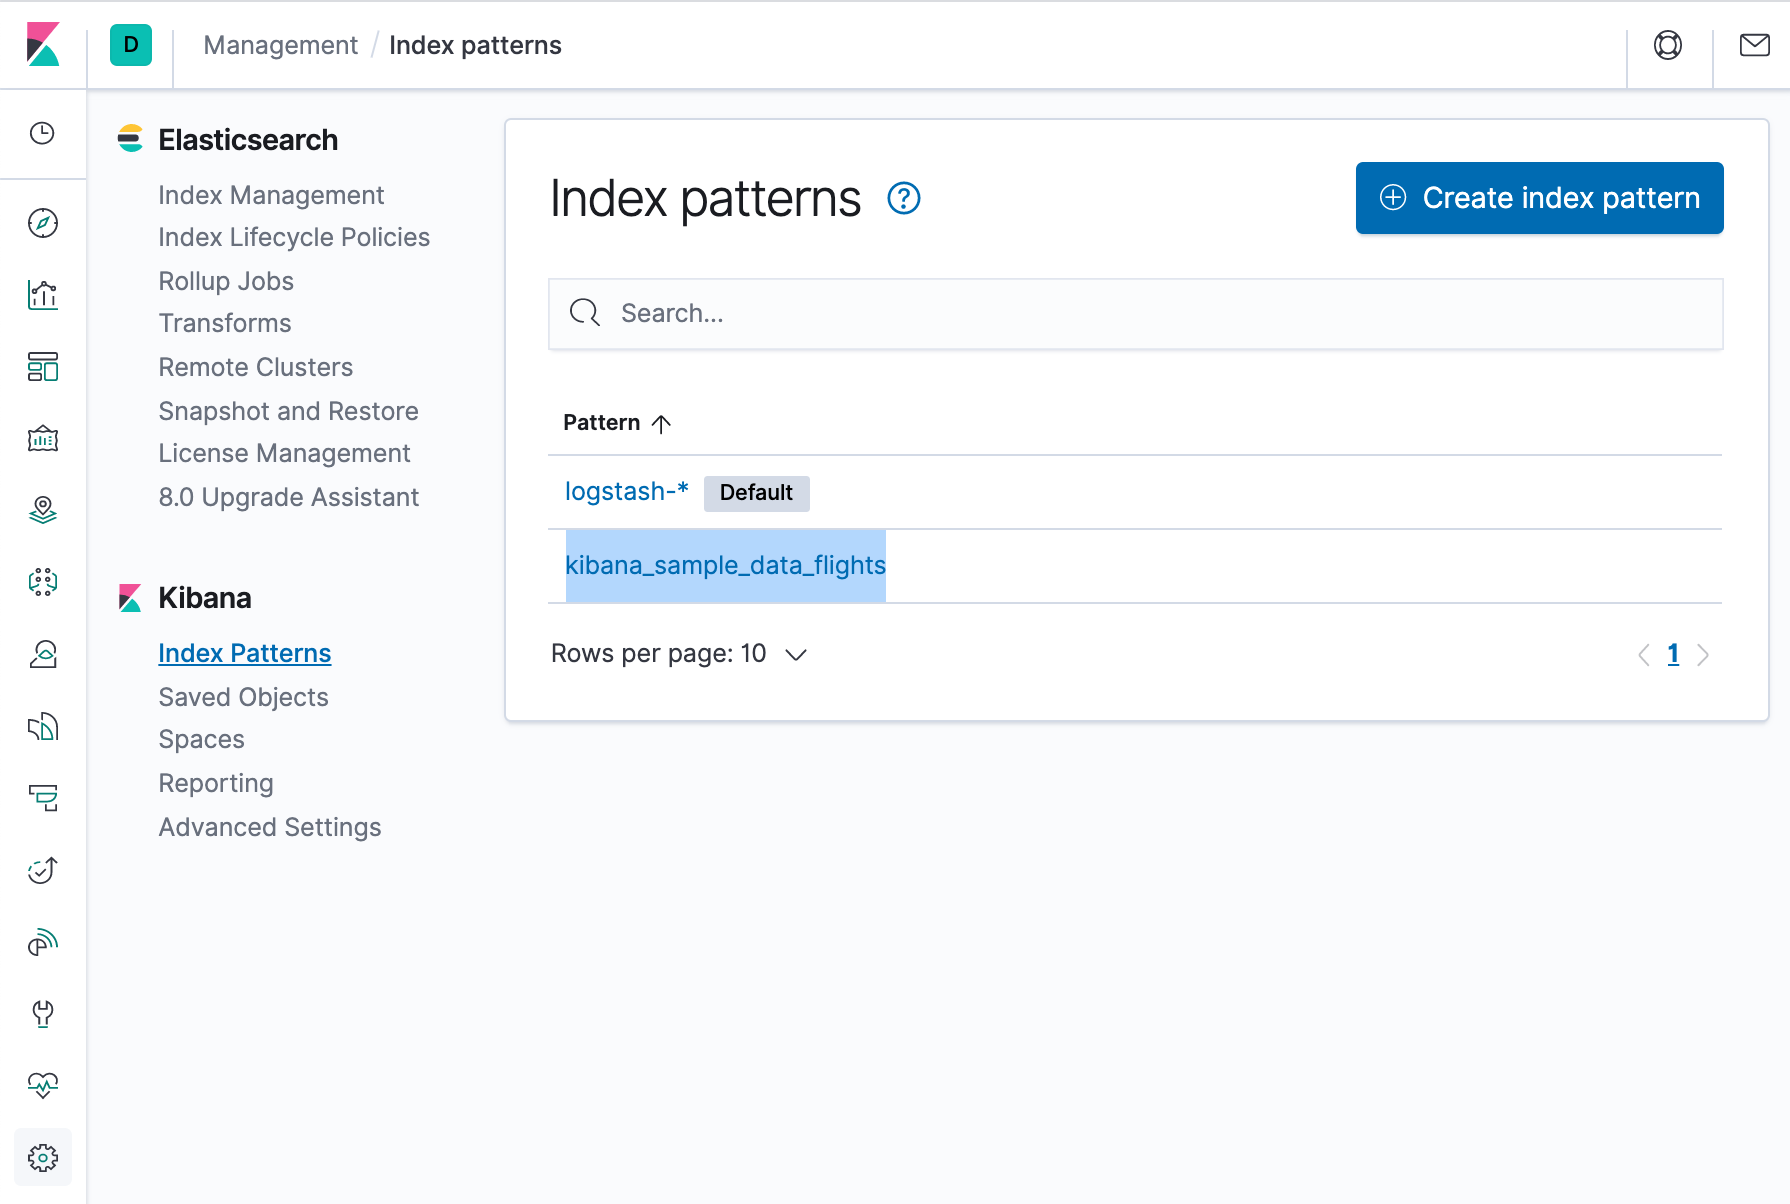
Specify an index pattern that matches the name of one or more of our Elasticsearch indices. The pattern can include an asterisk (*) to matches zero or more characters in an index's name. When filling out our index pattern, any matched indices will be displayed.
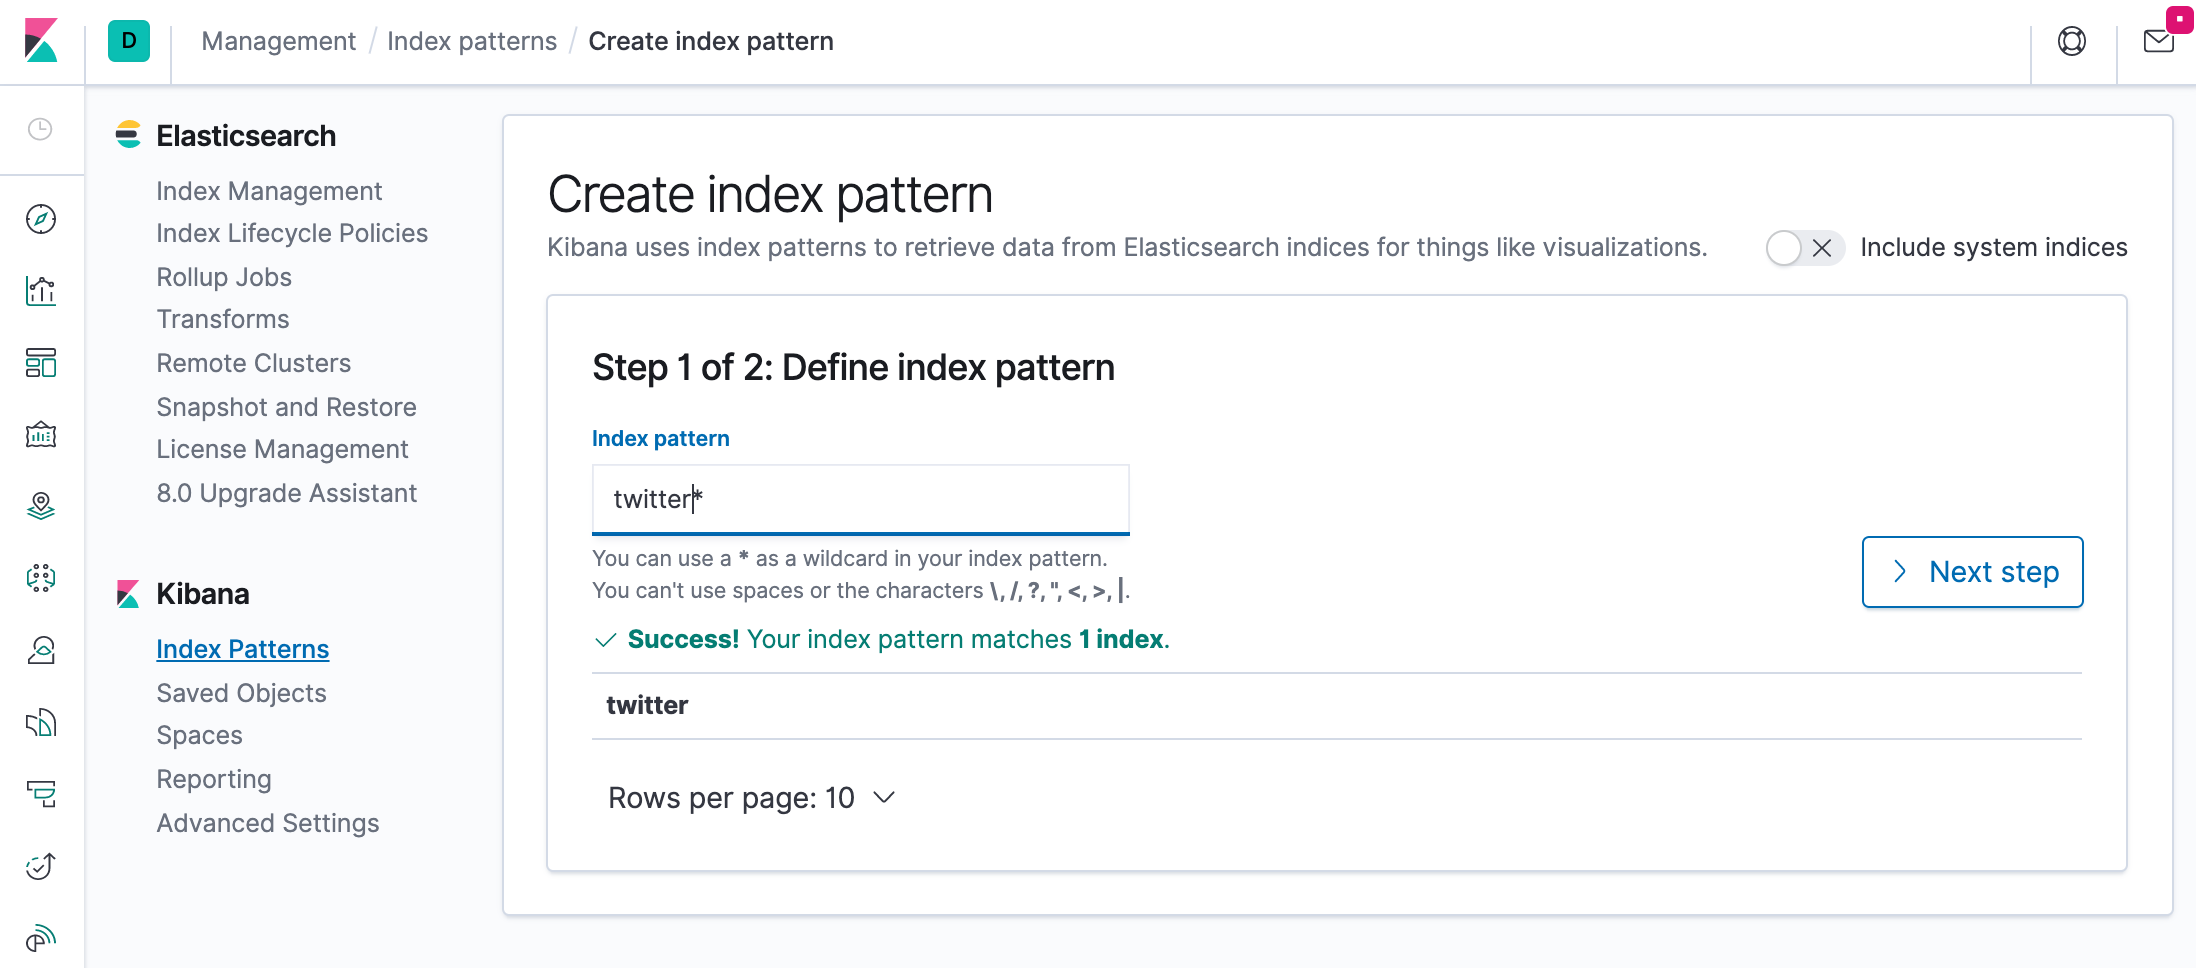
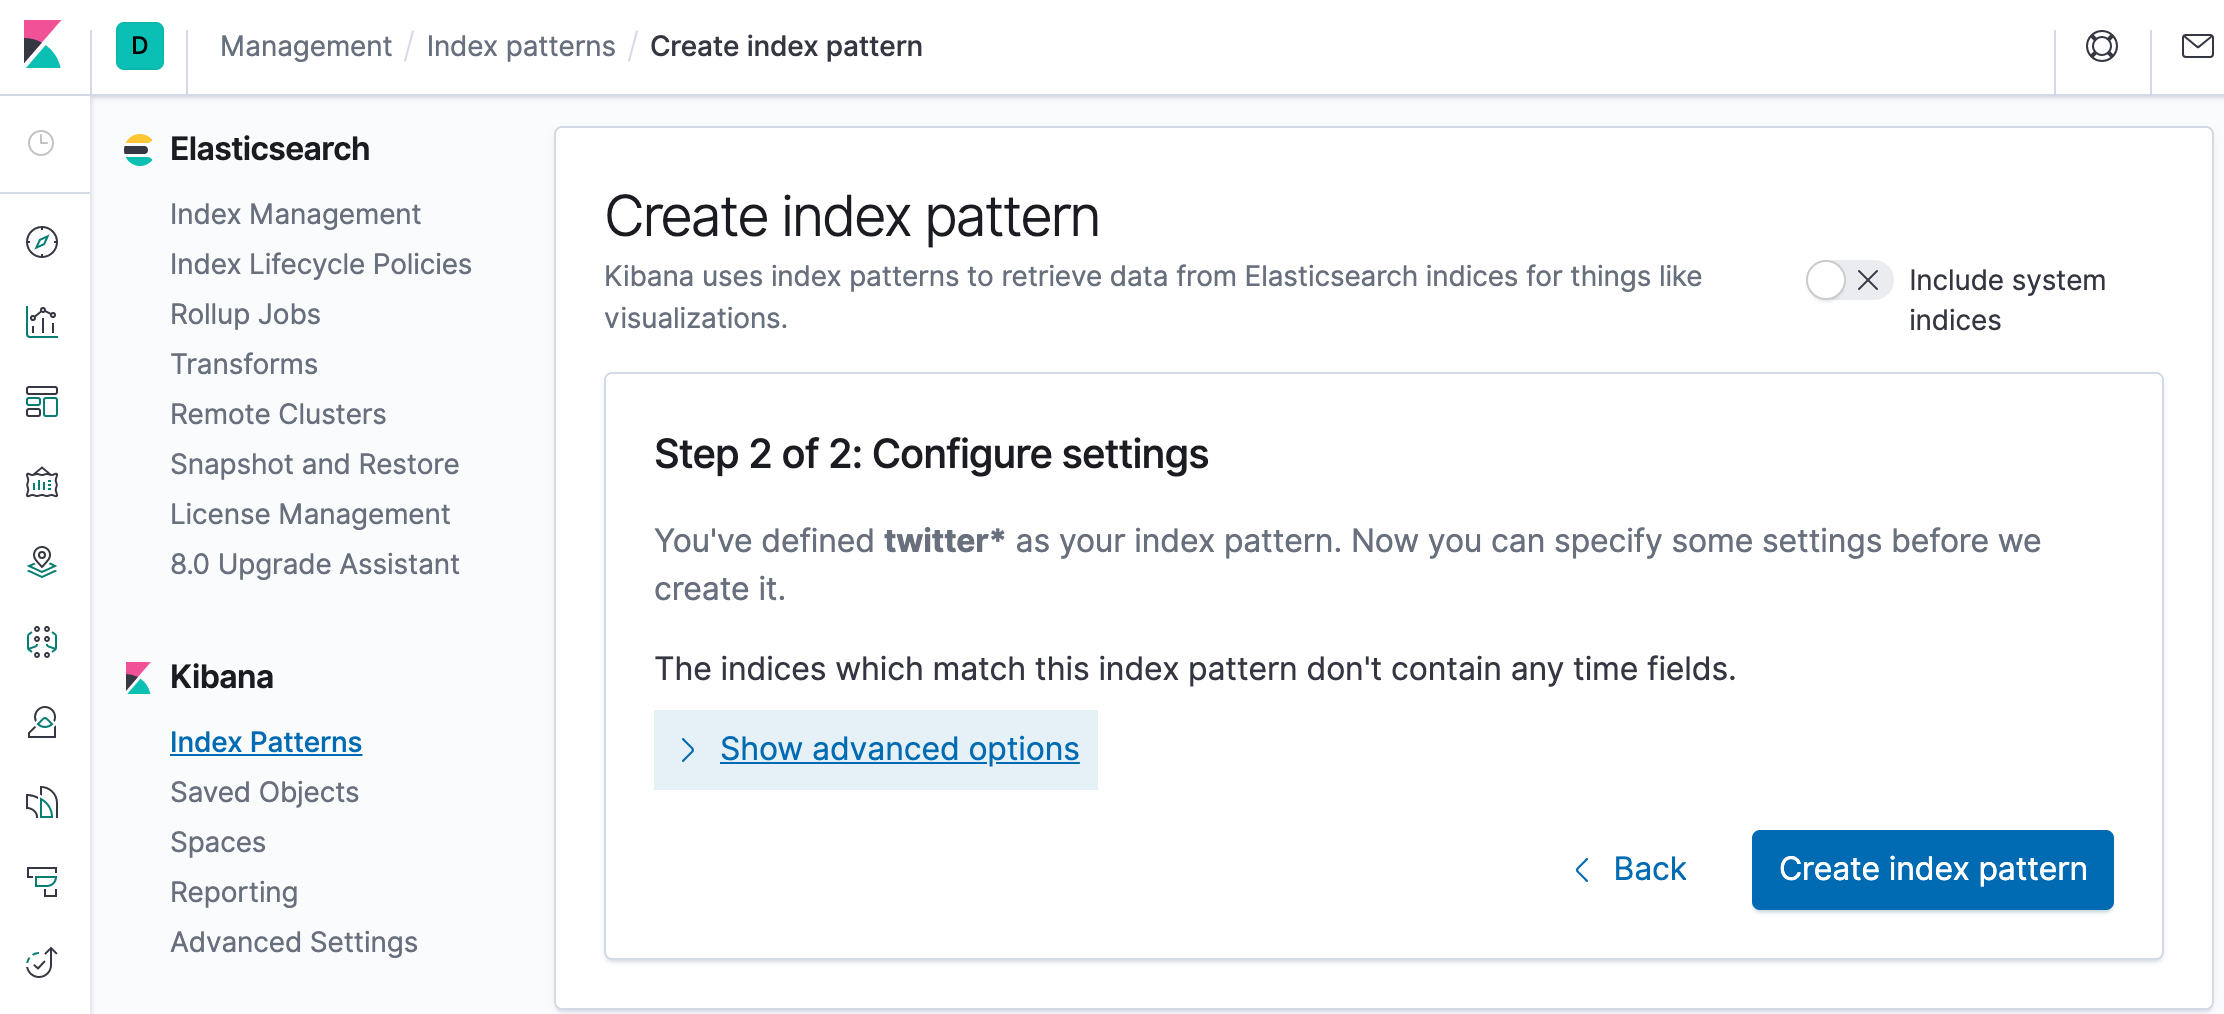
Click "Create index pattern" to add the index pattern. This first pattern is automatically configured as the default. When you have more than one index pattern, we can designate which one to use as the default by clicking on the star icon above the index pattern title from Management > Index Patterns.
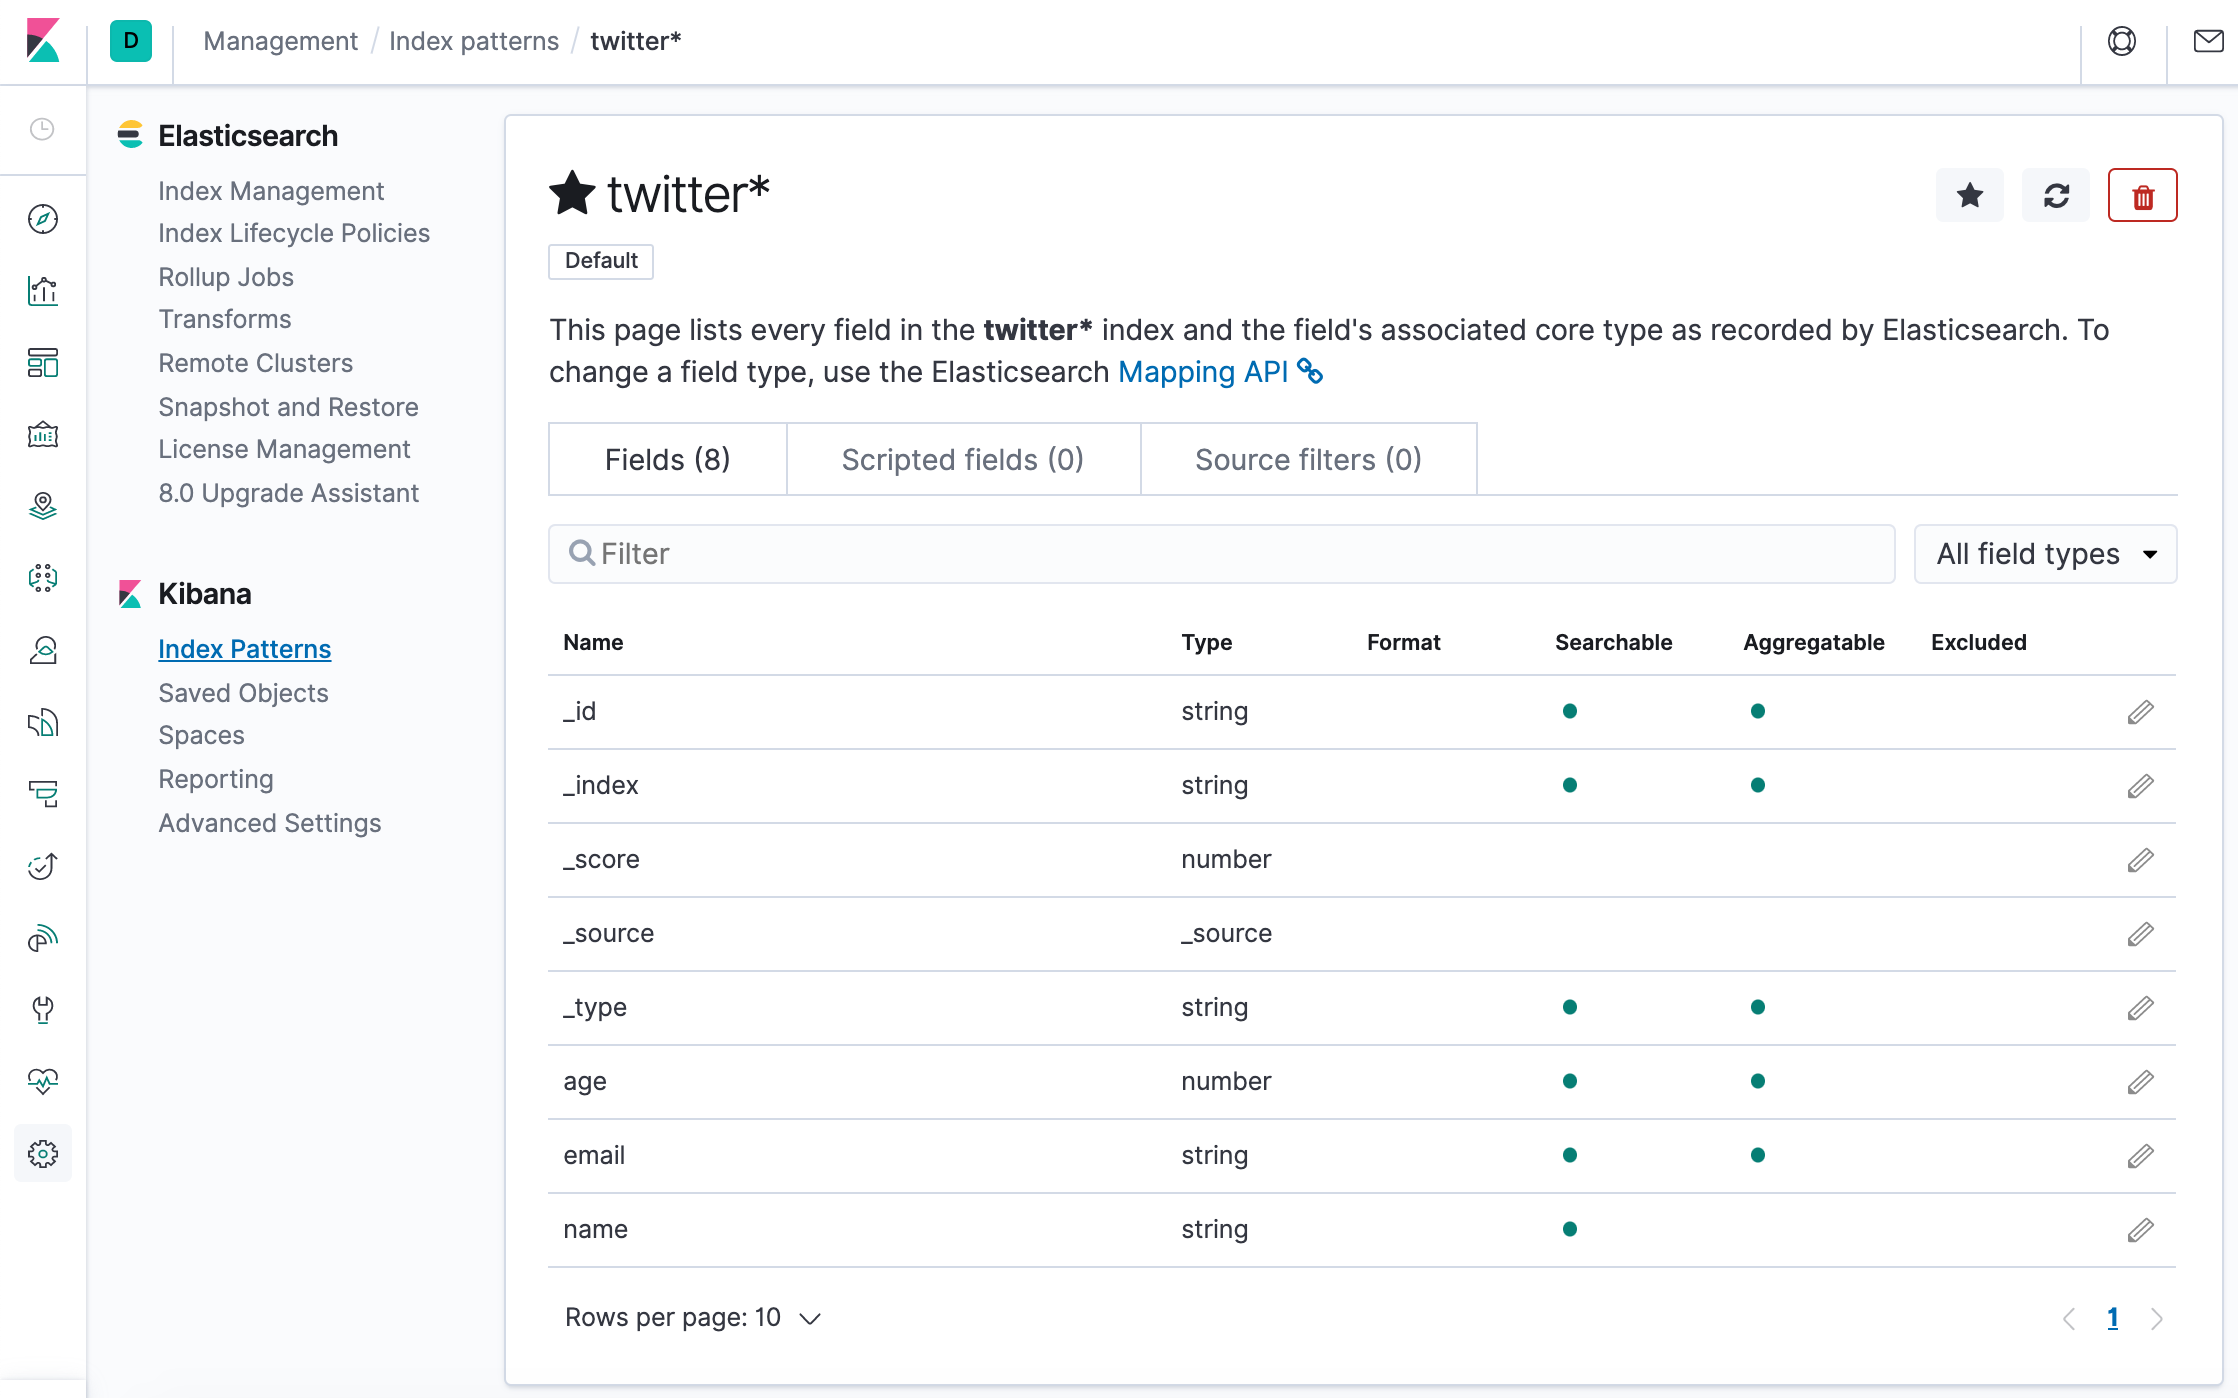
All done! Kibana is now connected to our Elasticsearch data. Kibana displays a read-only list of fields configured for the matching index.
The following sections are based on https://www.elastic.co/guide/en/kibana/7.6/tutorial-sample-data.html
Now, let's run ELK stack using ELK Stack with docker compose.
Before we do that, let's modify the setup for xpack in "elasticsearch/config/elasticsearch.yml" to set "xpack.security.enabled: true". Otherwise, we may the following error:
{"error":{"root_cause":[{"type":"security_exception","reason":"missing authentication credentials for REST request [/]","header":{"WWW-Authenticate":"Basic realm=\"security\" charset=\"UTF-8\""}}],"type":"security_exception","reason":"missing authentication credentials for REST request [/]","header":{"WWW-Authenticate":"Basic realm=\"security\" charset=\"UTF-8\""}},"status":401}
$ docker-compose up -d
Creating network "einsteinish-elk-stack-with-docker-compose_elk" with driver "bridge"
Creating einsteinish-elk-stack-with-docker-compose_elasticsearch_1 ... done
Creating einsteinish-elk-stack-with-docker-compose_kibana_1        ... done
Creating einsteinish-elk-stack-with-docker-compose_logstash_1      ... done

$ docker-compose ps
                          Name                                         Command               State                                        Ports
-------------------------------------------------------------------------------------------------------------------------------------------------------------------------------------
einsteinish-elk-stack-with-docker-compose_elasticsearch_1   /usr/local/bin/docker-entr ...   Up      0.0.0.0:9200->9200/tcp, 0.0.0.0:9300->9300/tcp
einsteinish-elk-stack-with-docker-compose_kibana_1          /usr/local/bin/dumb-init - ...   Up      0.0.0.0:5601->5601/tcp
einsteinish-elk-stack-with-docker-compose_logstash_1        /usr/local/bin/docker-entr ...   Up      0.0.0.0:5000->5000/tcp, 0.0.0.0:5000->5000/udp, 5044/tcp, 0.0.0.0:9600->9600/tcp
$
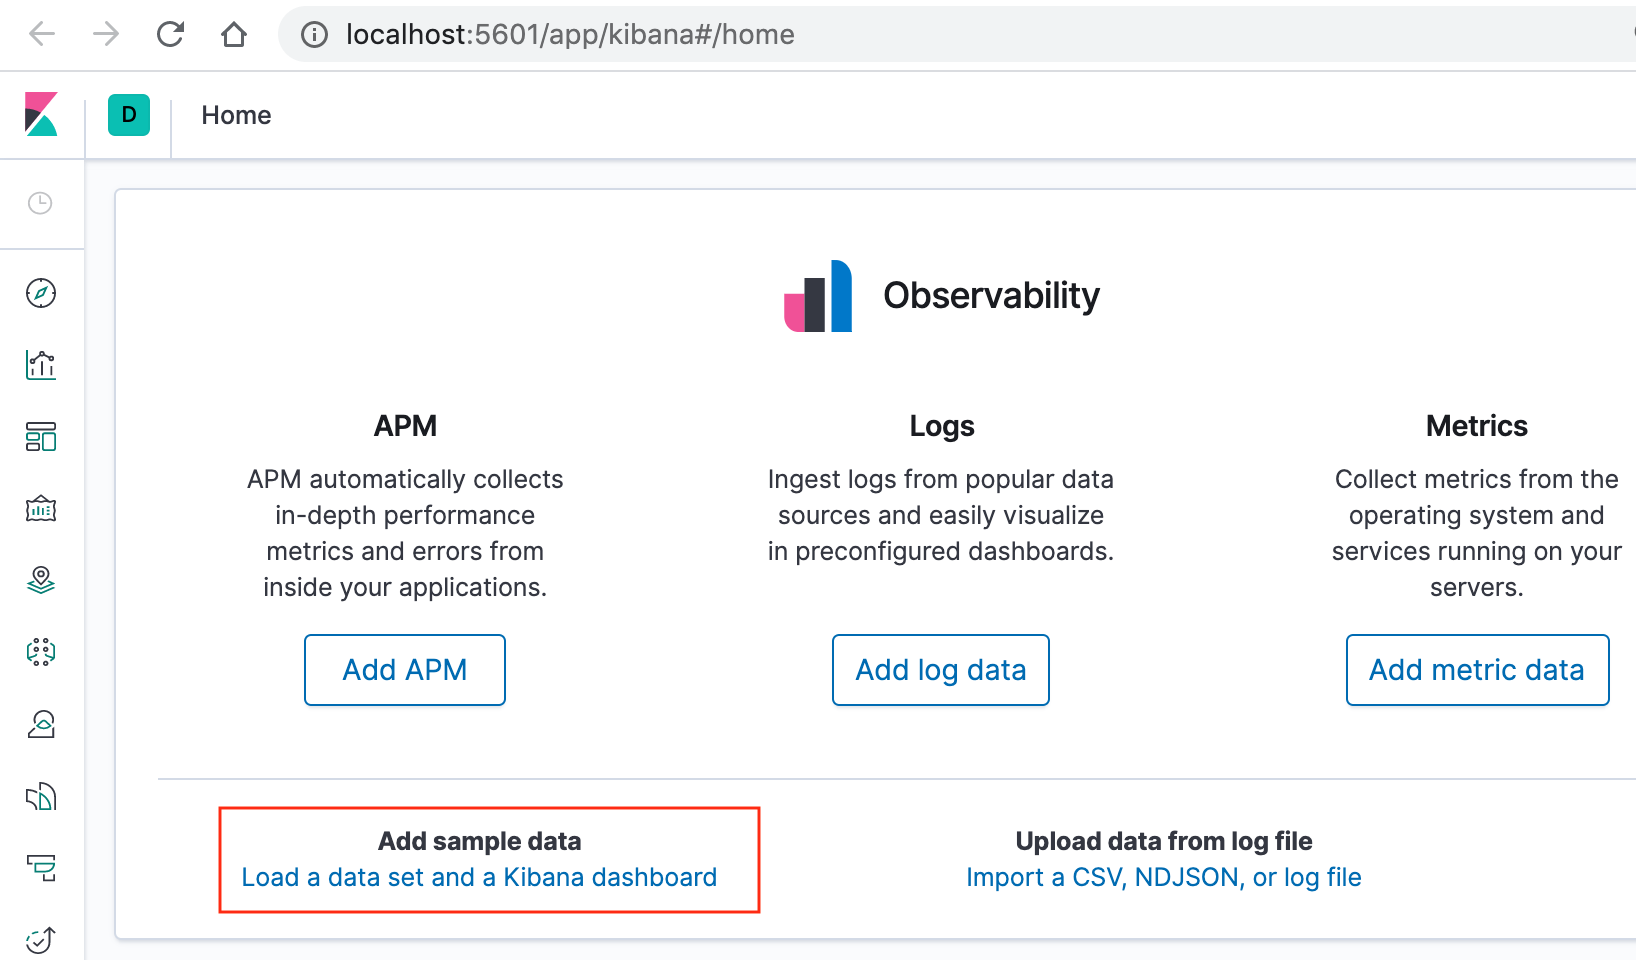
On the Kibana home page, click the link underneath Add sample data.
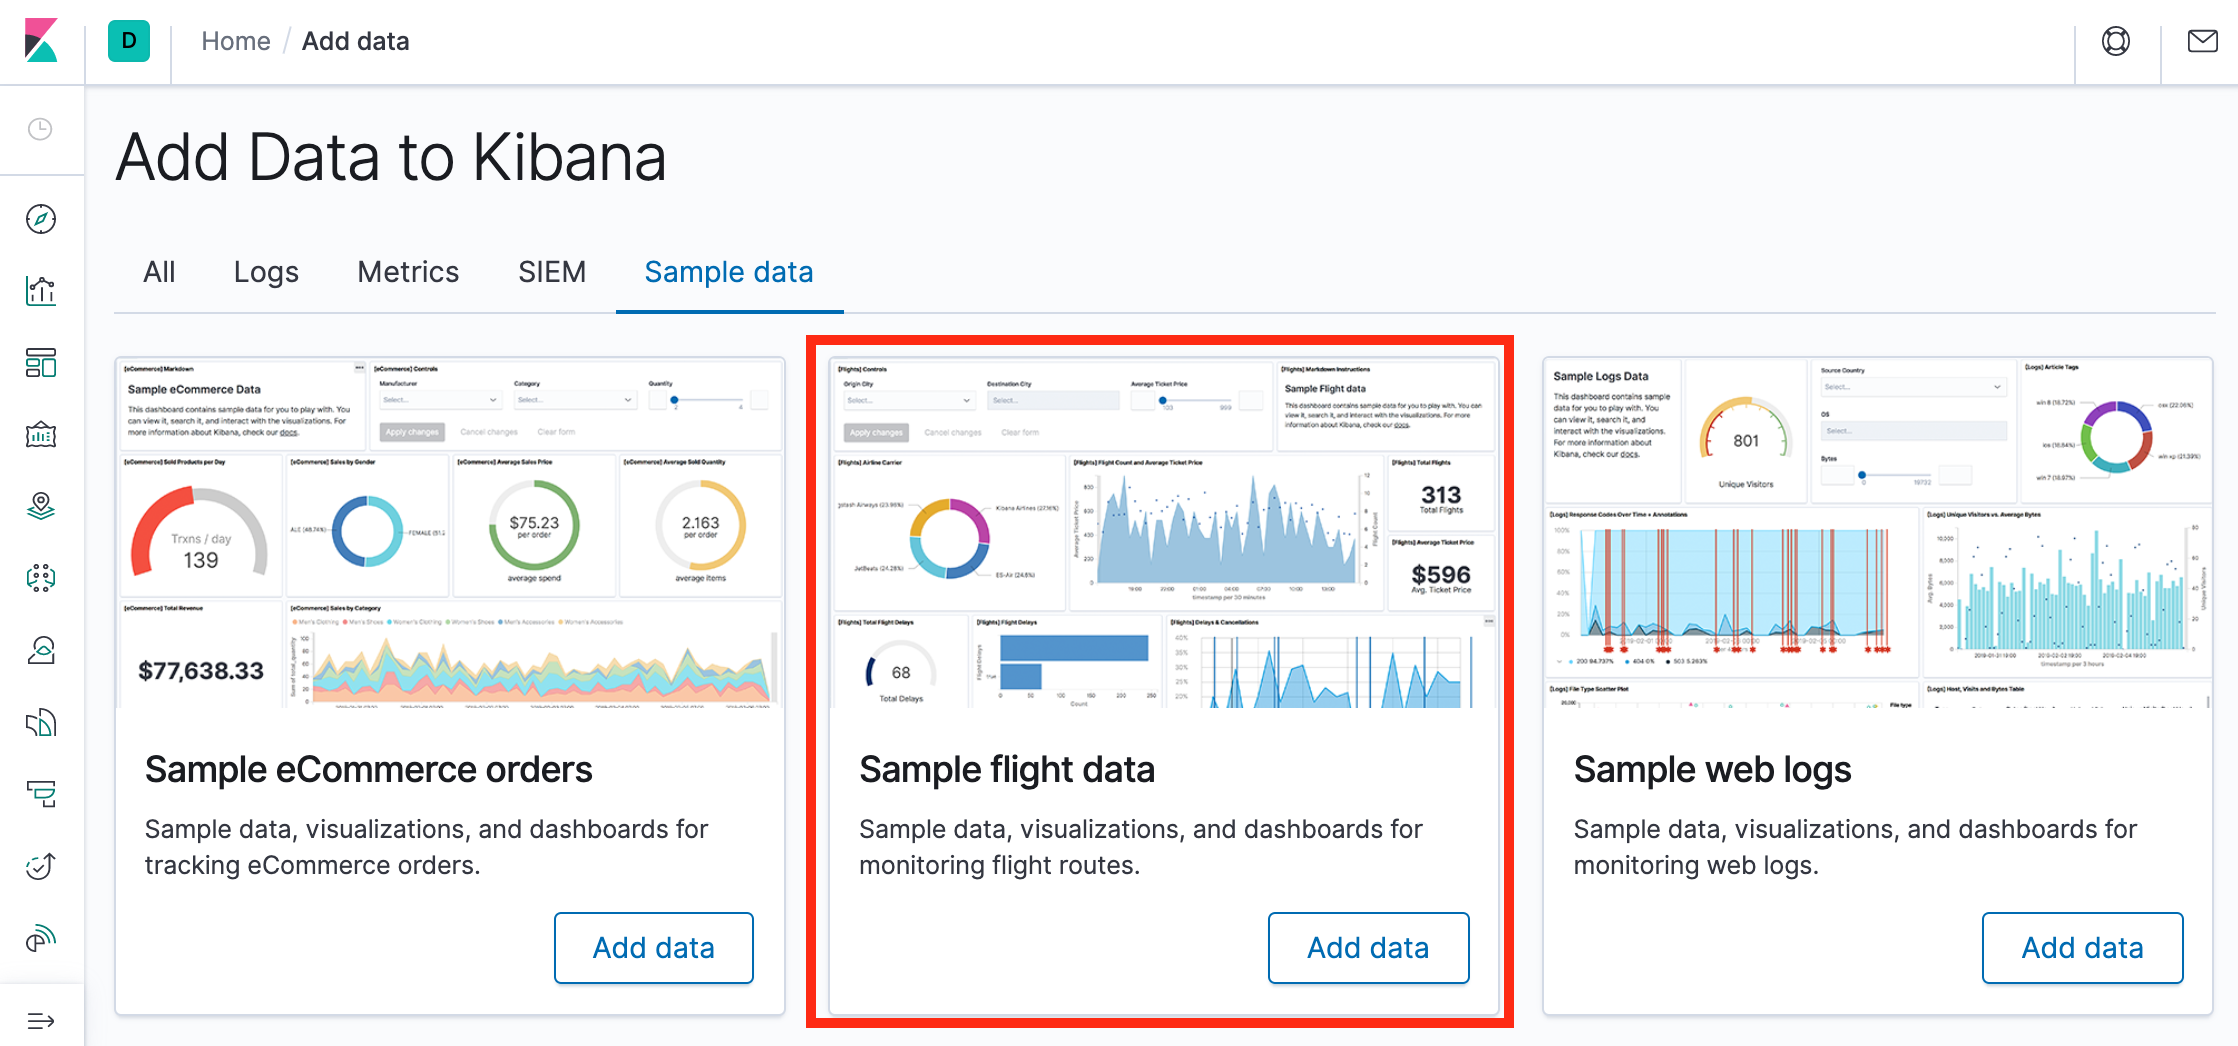
On the Sample flight data card, click Add data.
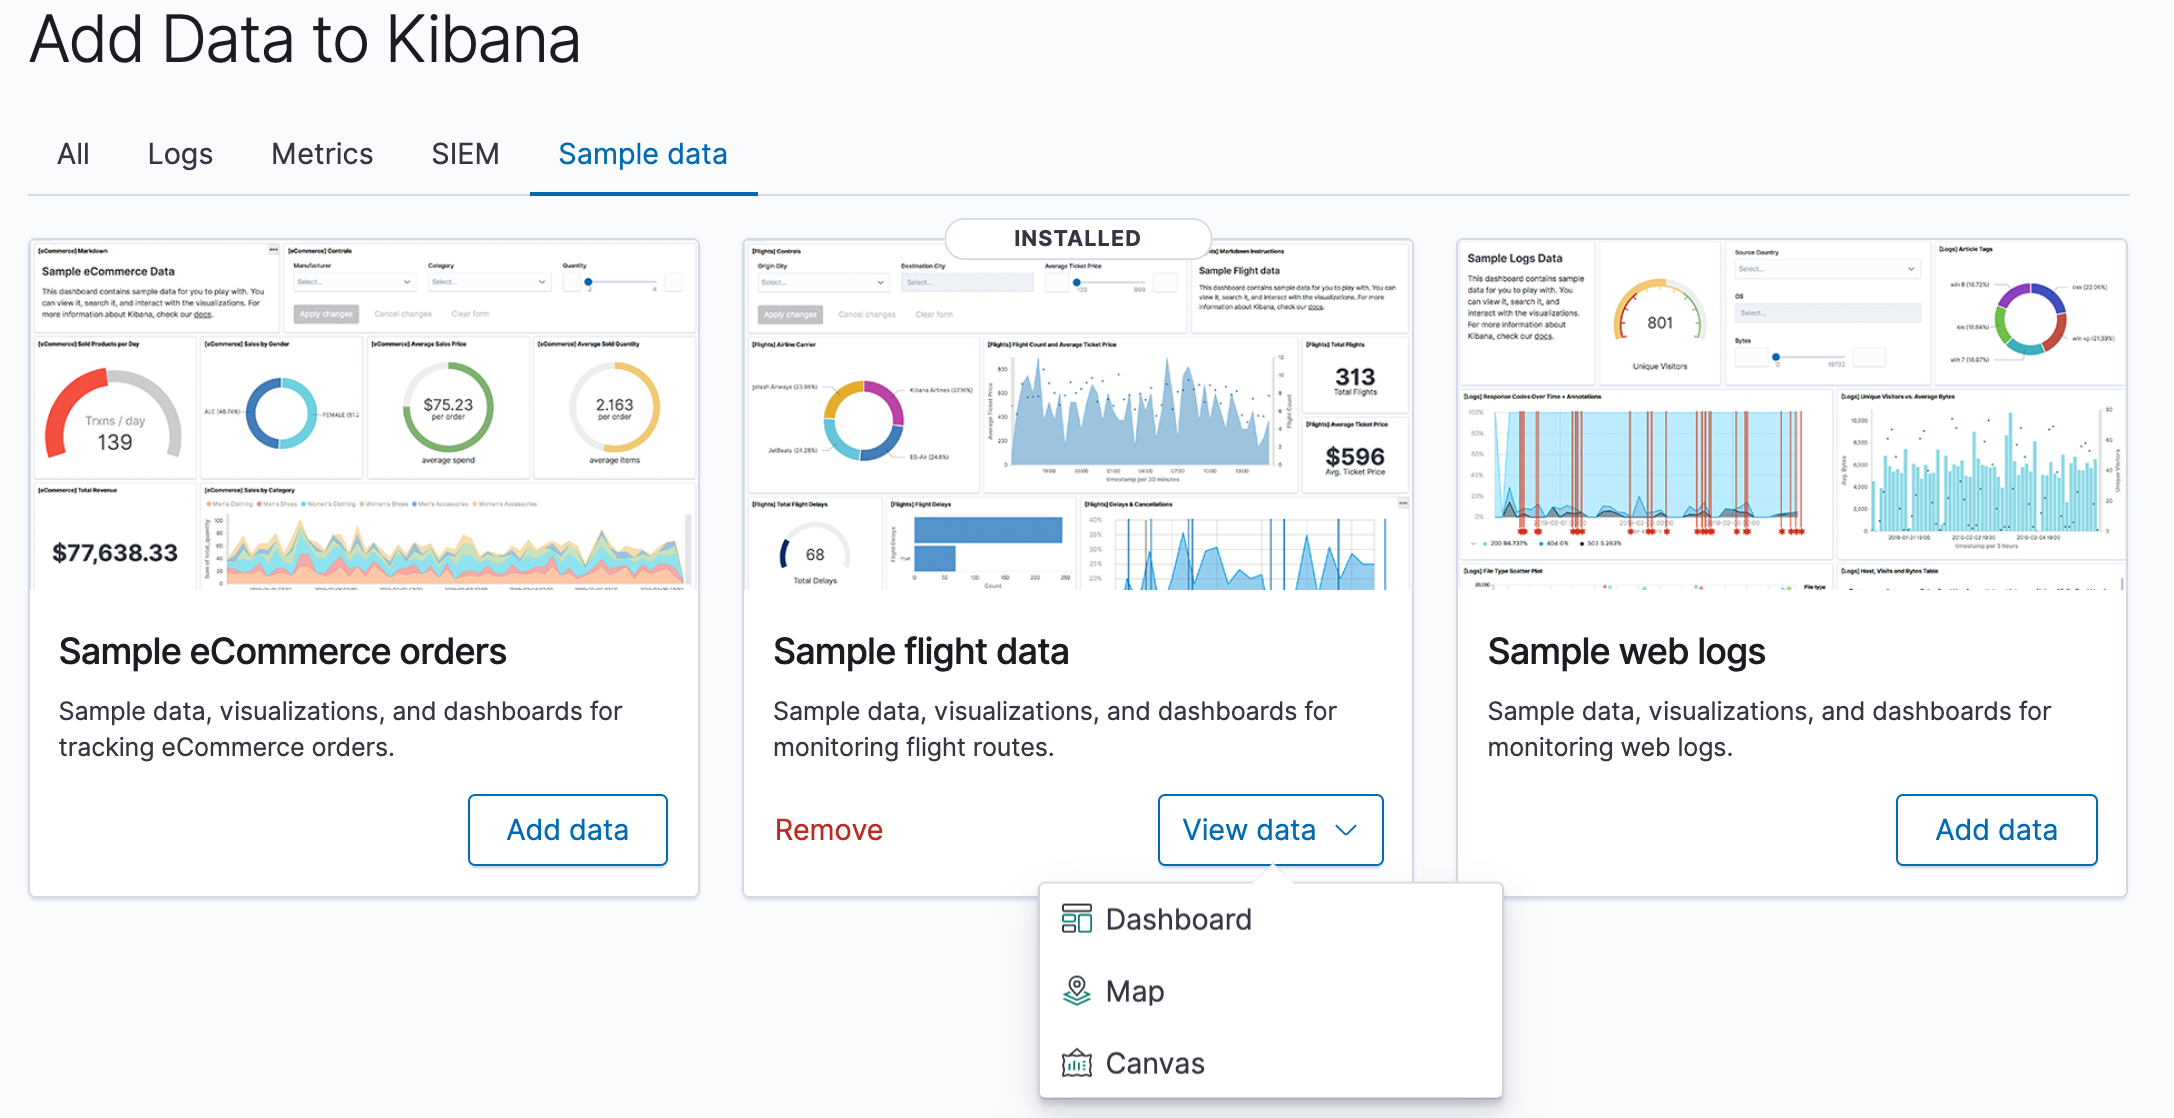
Once the data is added, click View data > Dashboard.
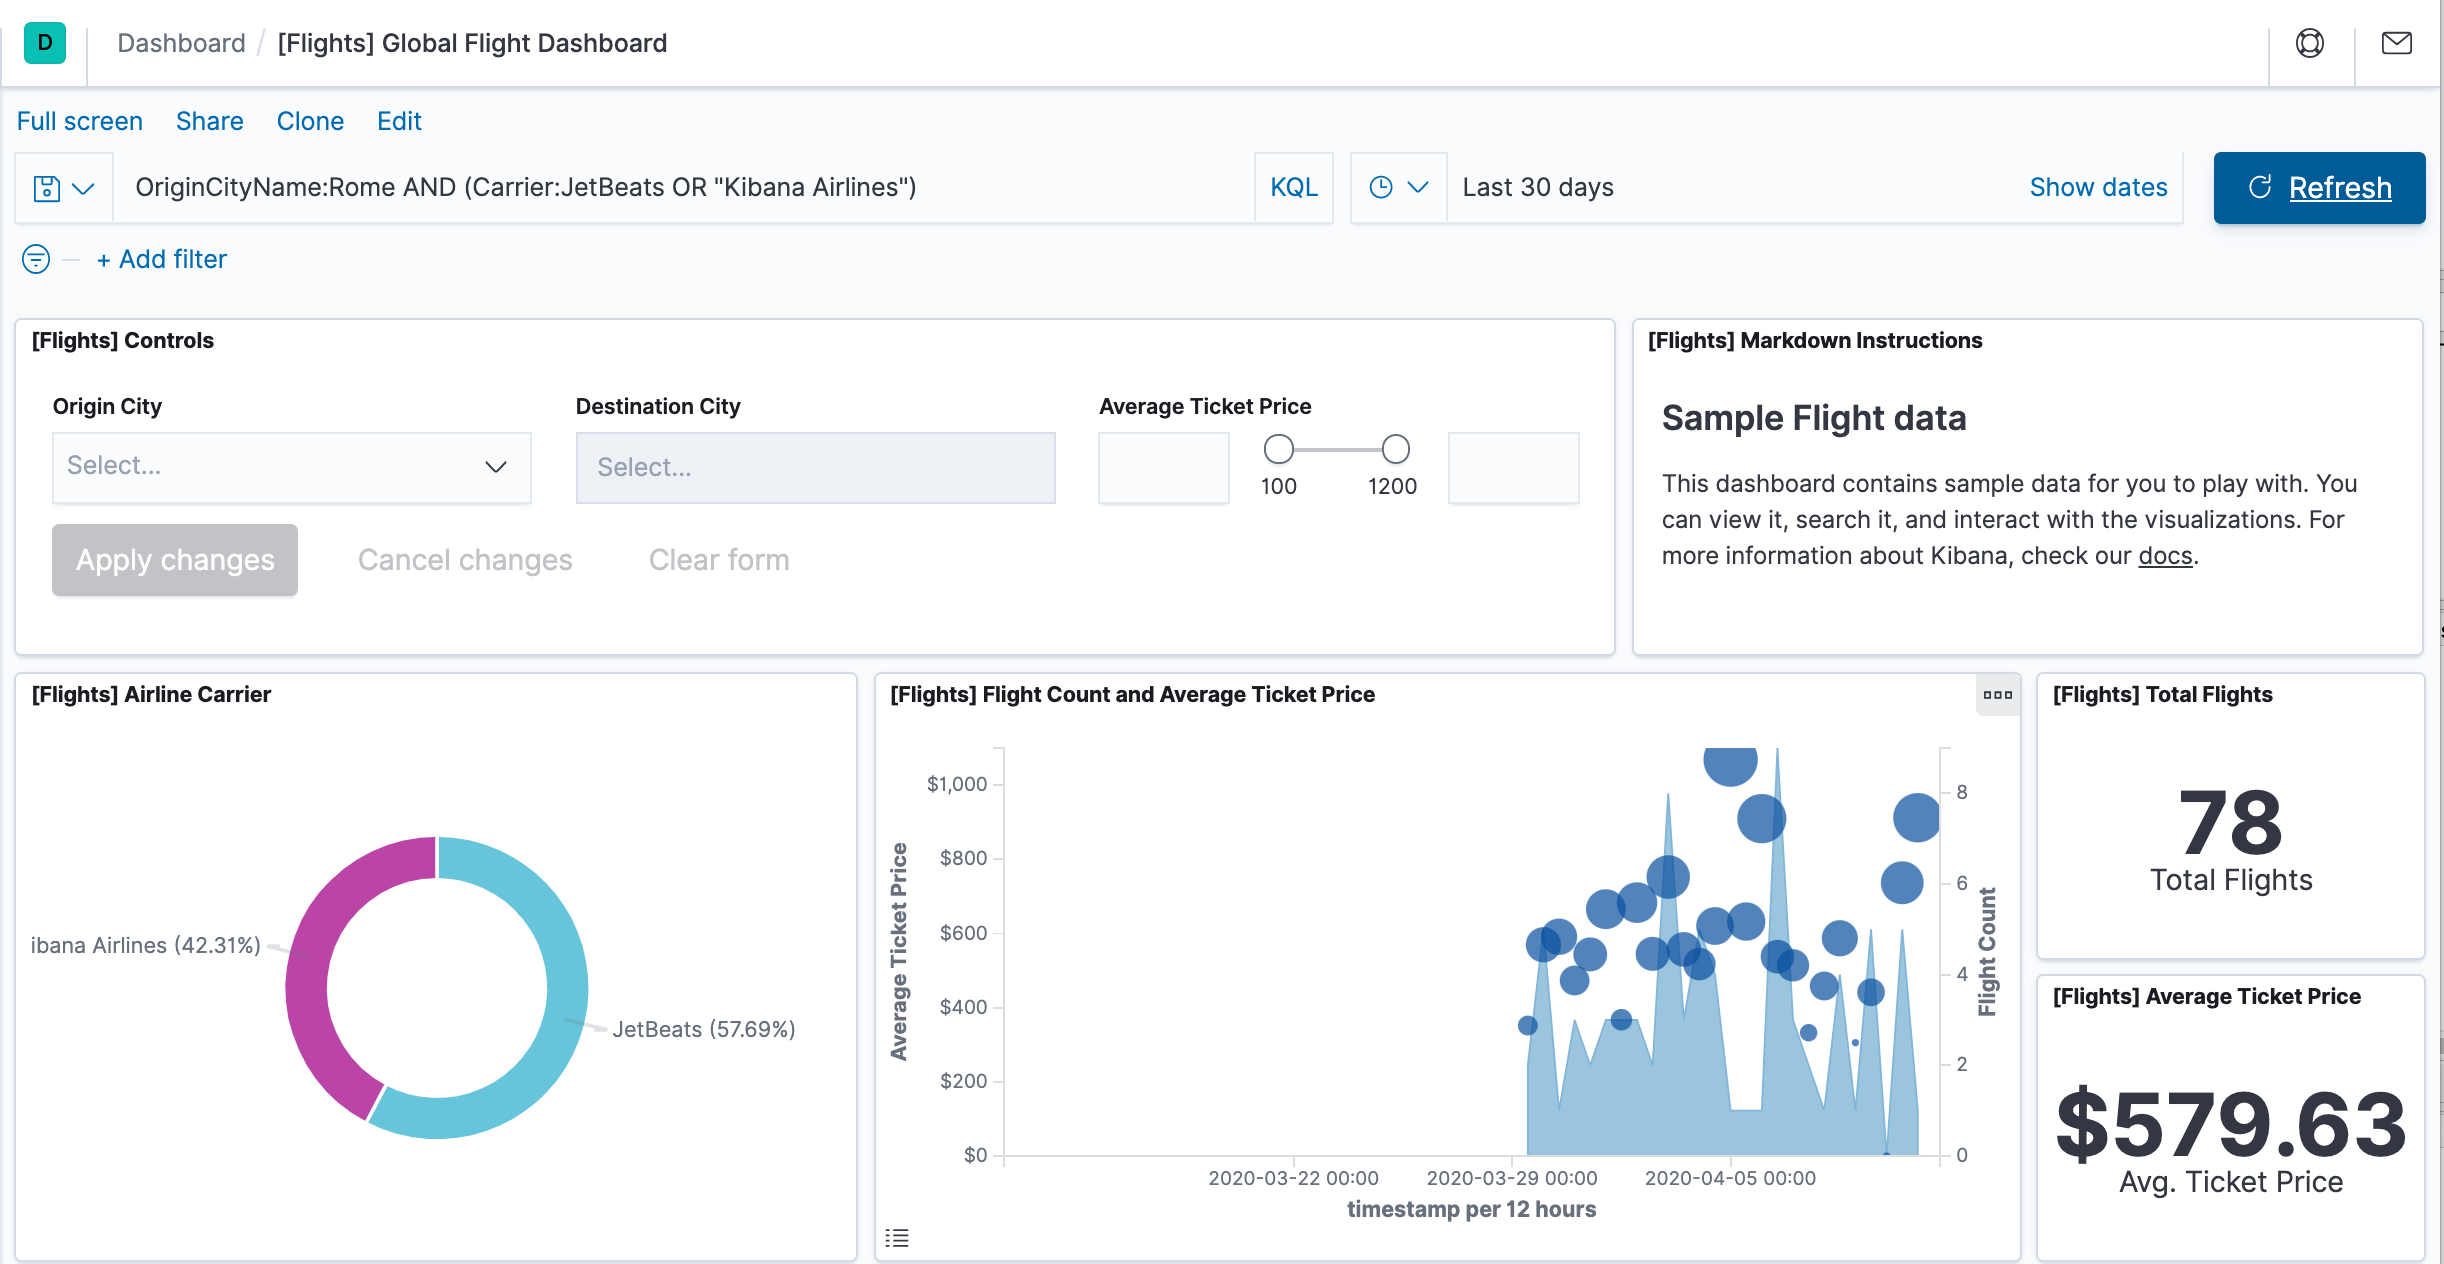
Now, we are on the Global Flight dashboard, a collection of charts, graphs, maps, and other visualizations of the the data in the kibana_sample_data_flights index.
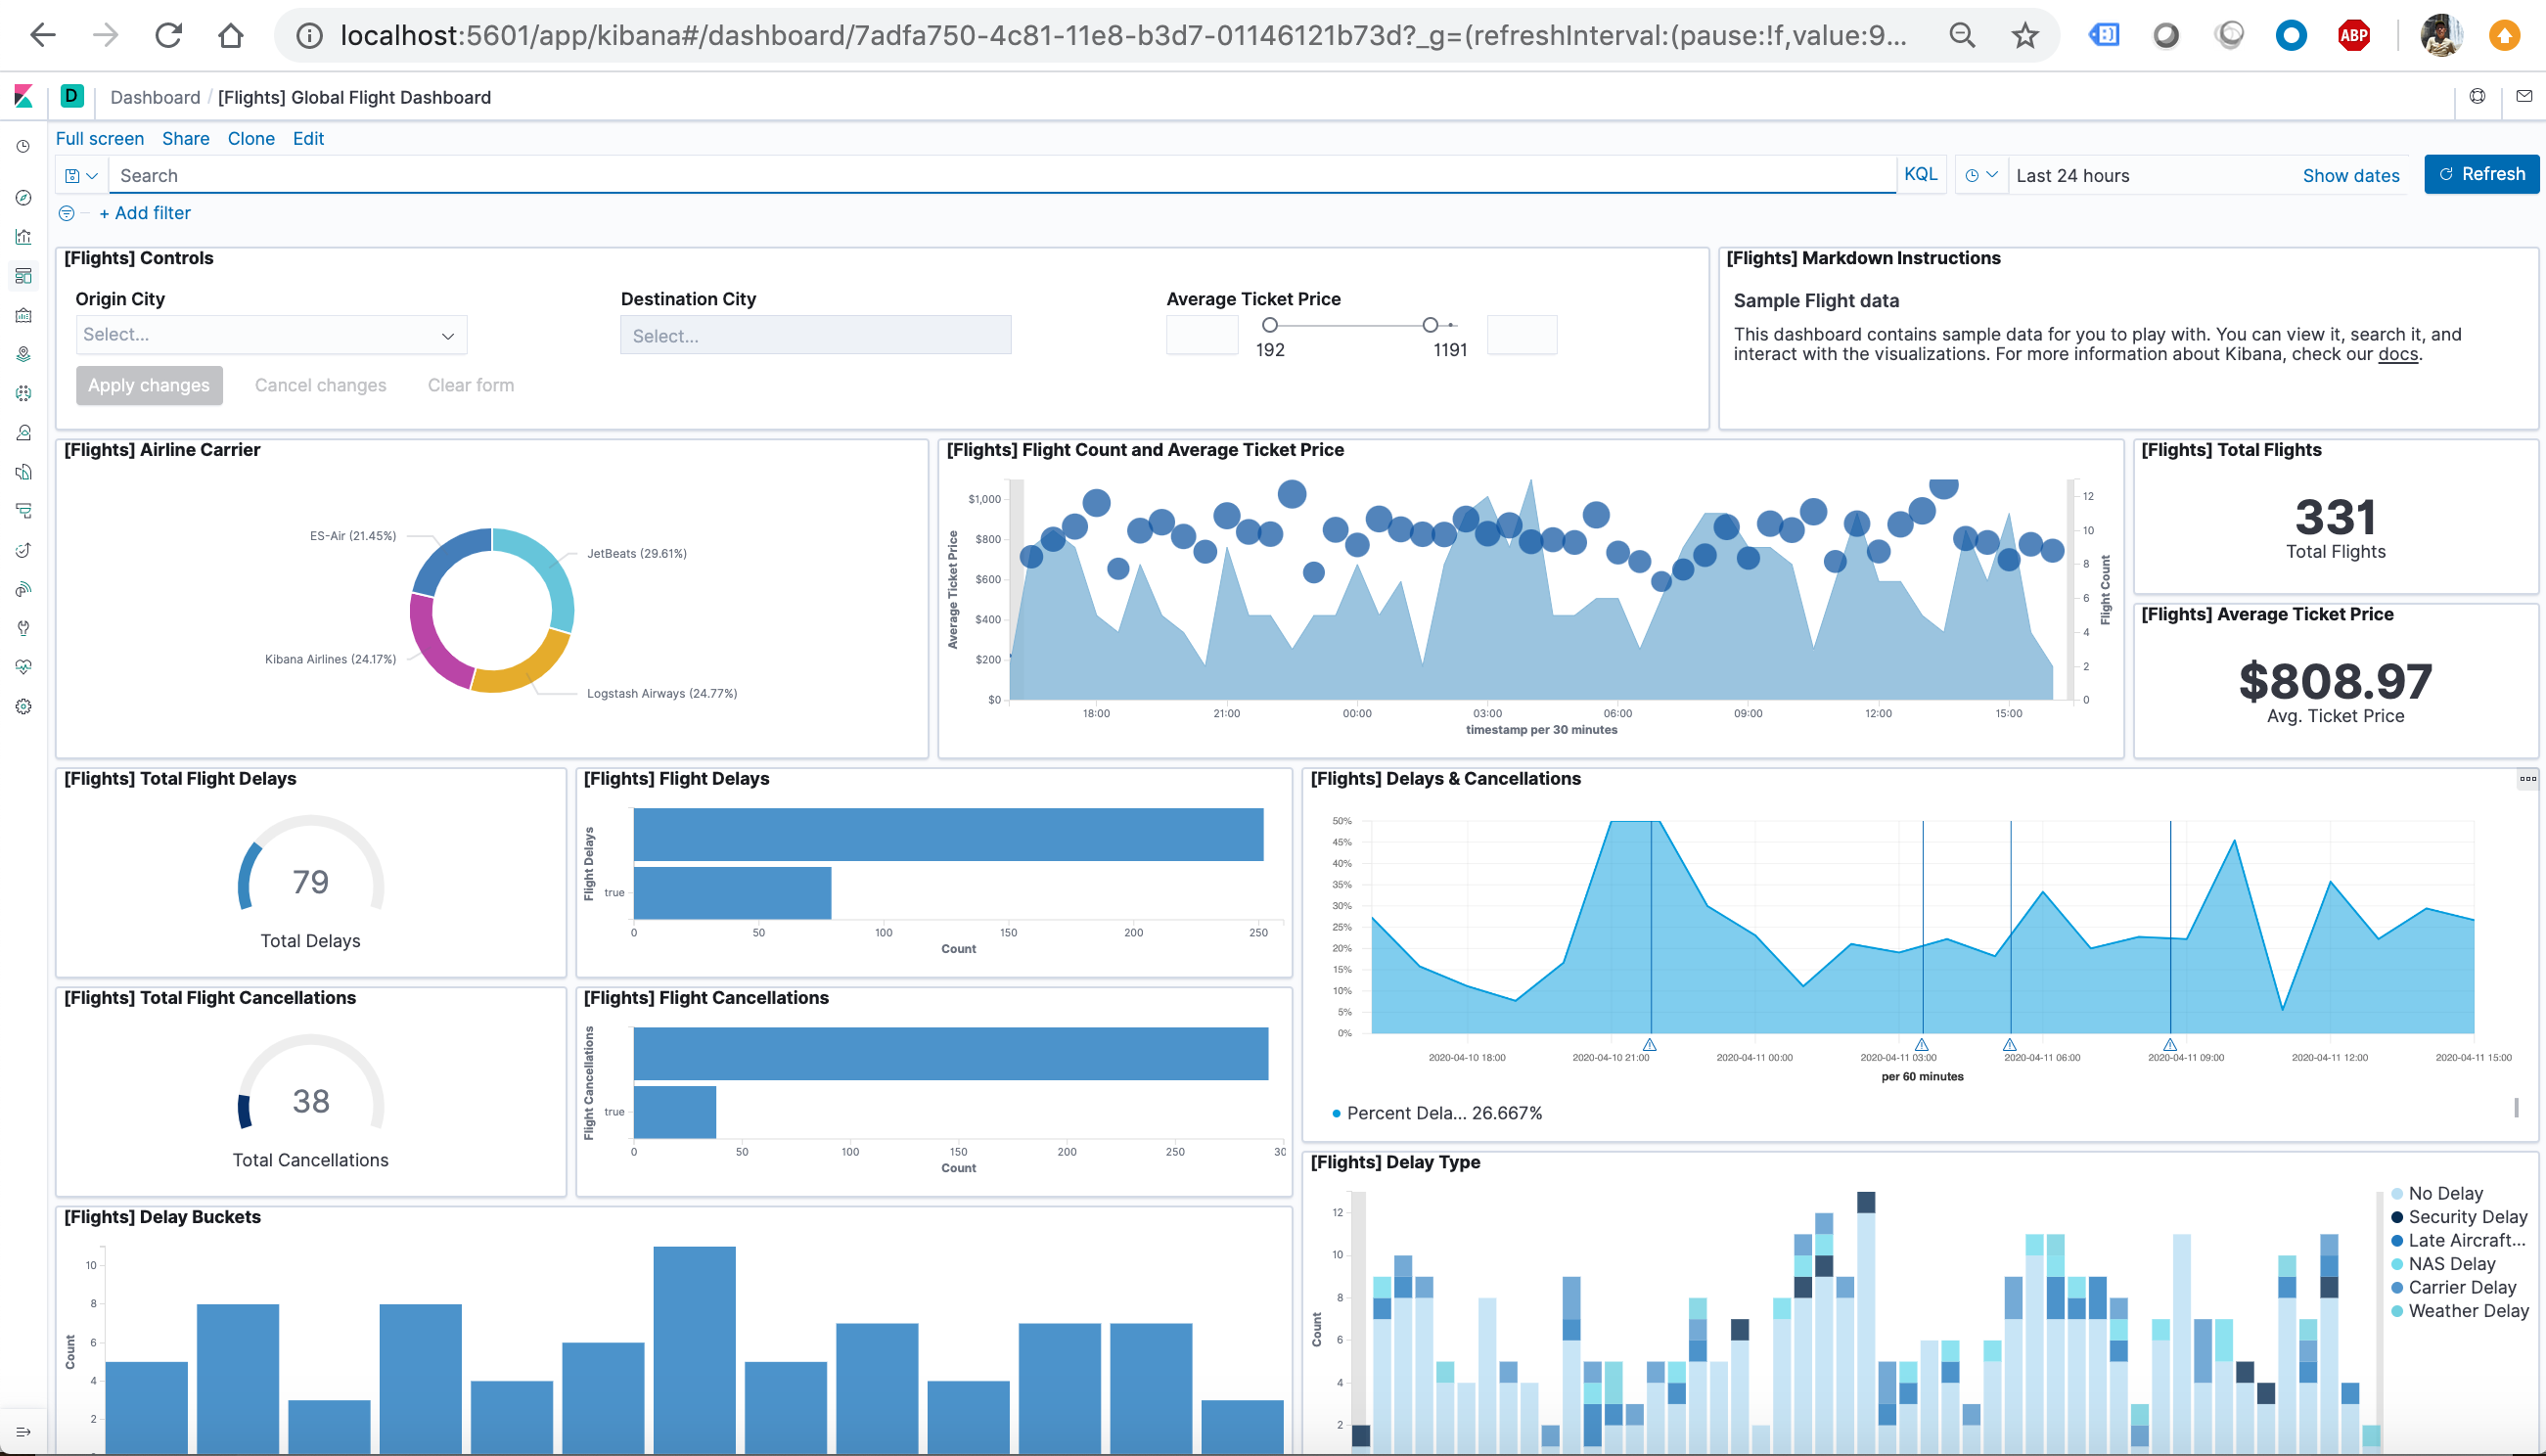
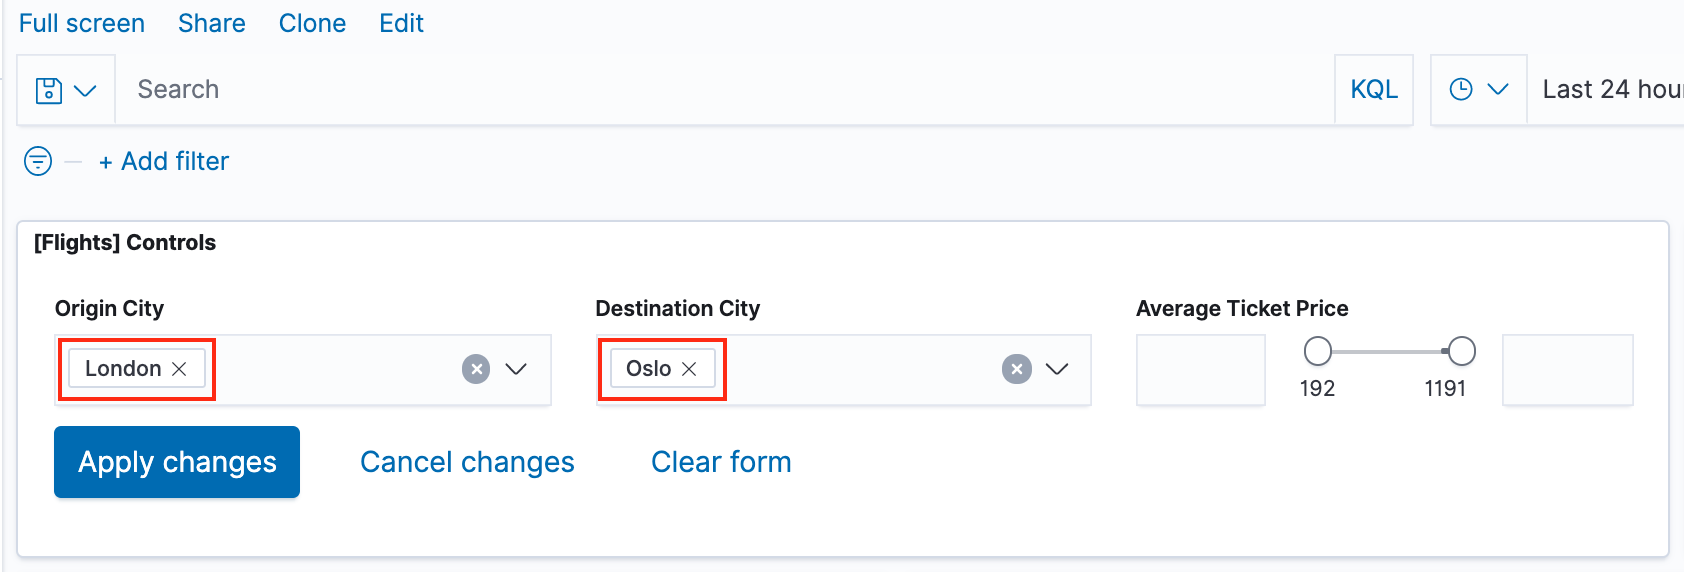
- In the Controls visualization, set an Origin City and a Destination City.
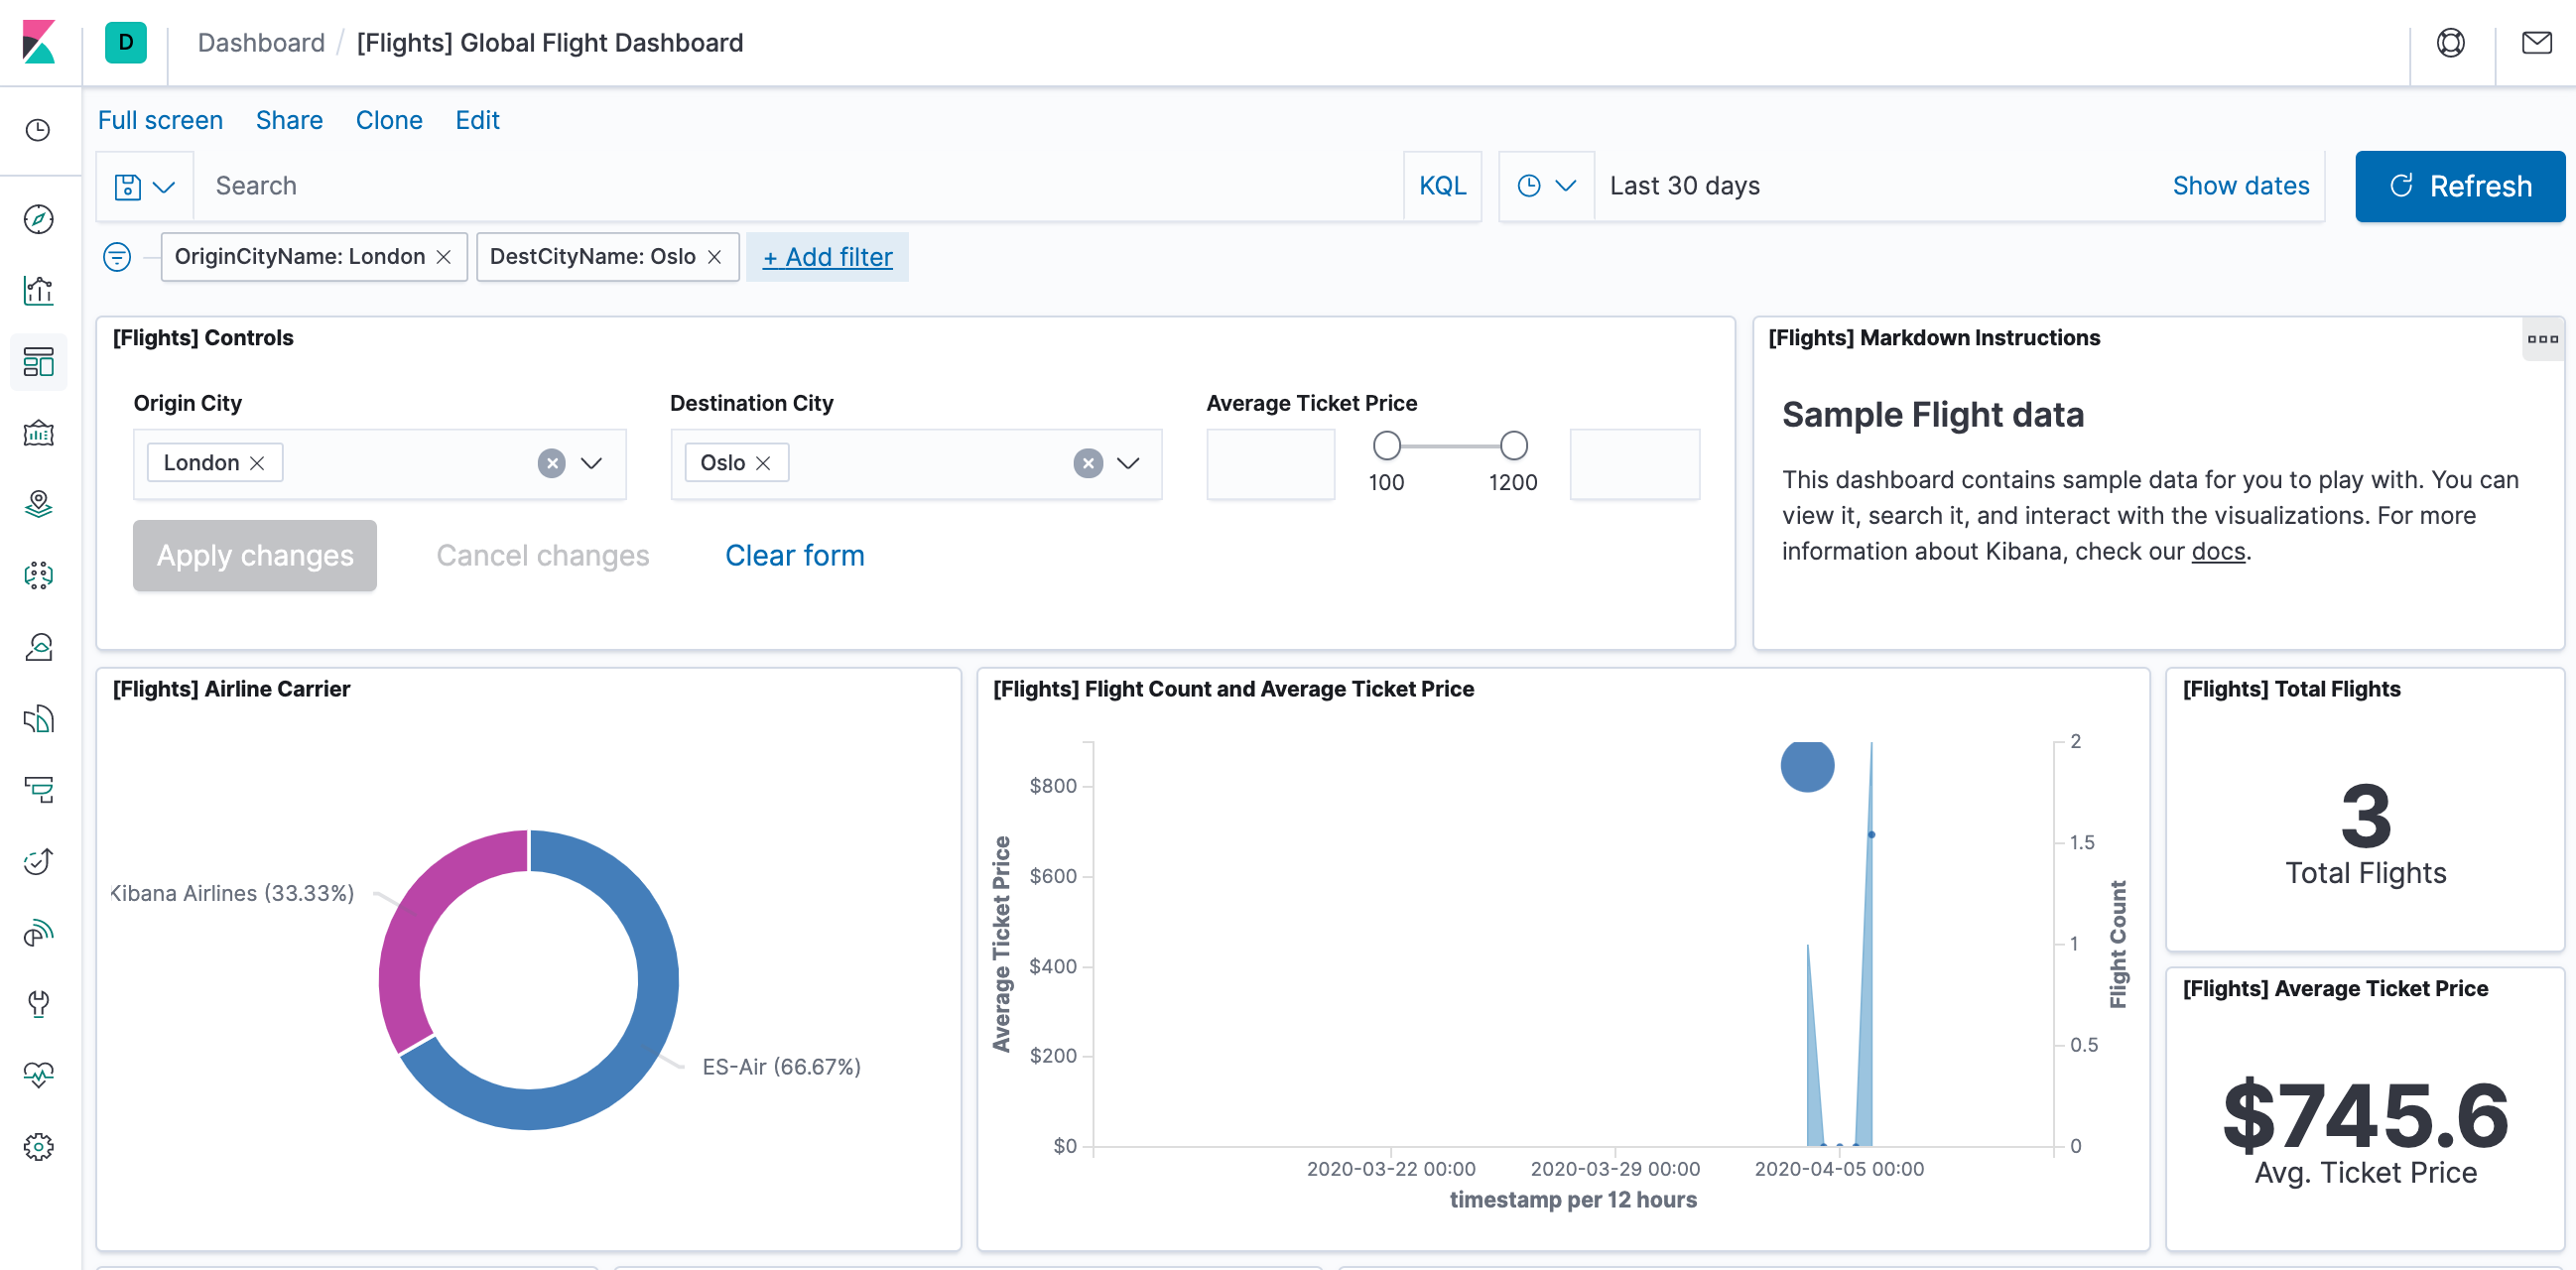
- Click Apply changes. The OriginCityName and the DestCityName fields are filtered to match the data we specified. For example, this dashboard shows the data for flights from London to Oslo.
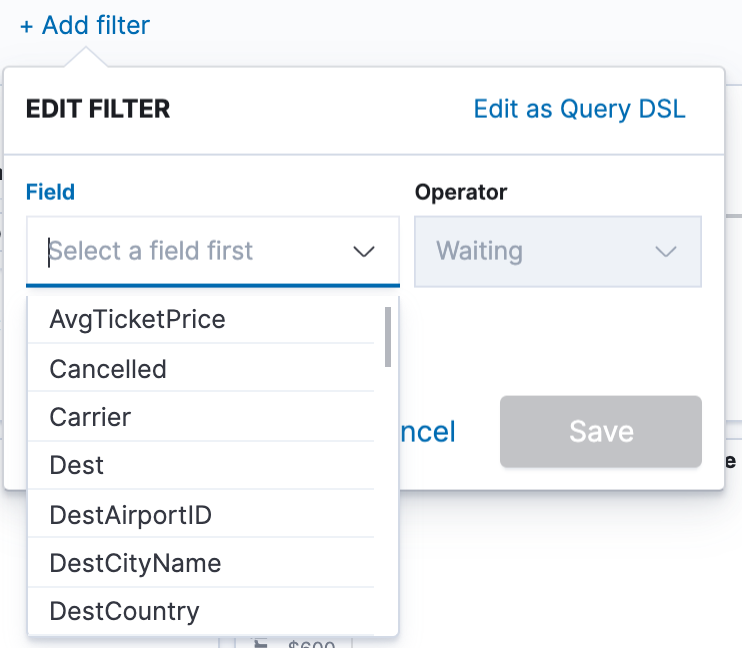
- To add a filter manually, click Add filter in the filter bar, and specify the data we want to view.
- When we are finished experimenting, remove all filters.
- To find all flights out of Rome, enter this query in the query bar and click Update:
OriginCityName:Rome
- For a more complex query with AND and OR, try this:
OriginCityName:Rome AND (Carrier:JetBeats OR "Kibana Airlines")
- When finished exploring the dashboard, remove the query by clearing the contents in the query bar and clicking Update.

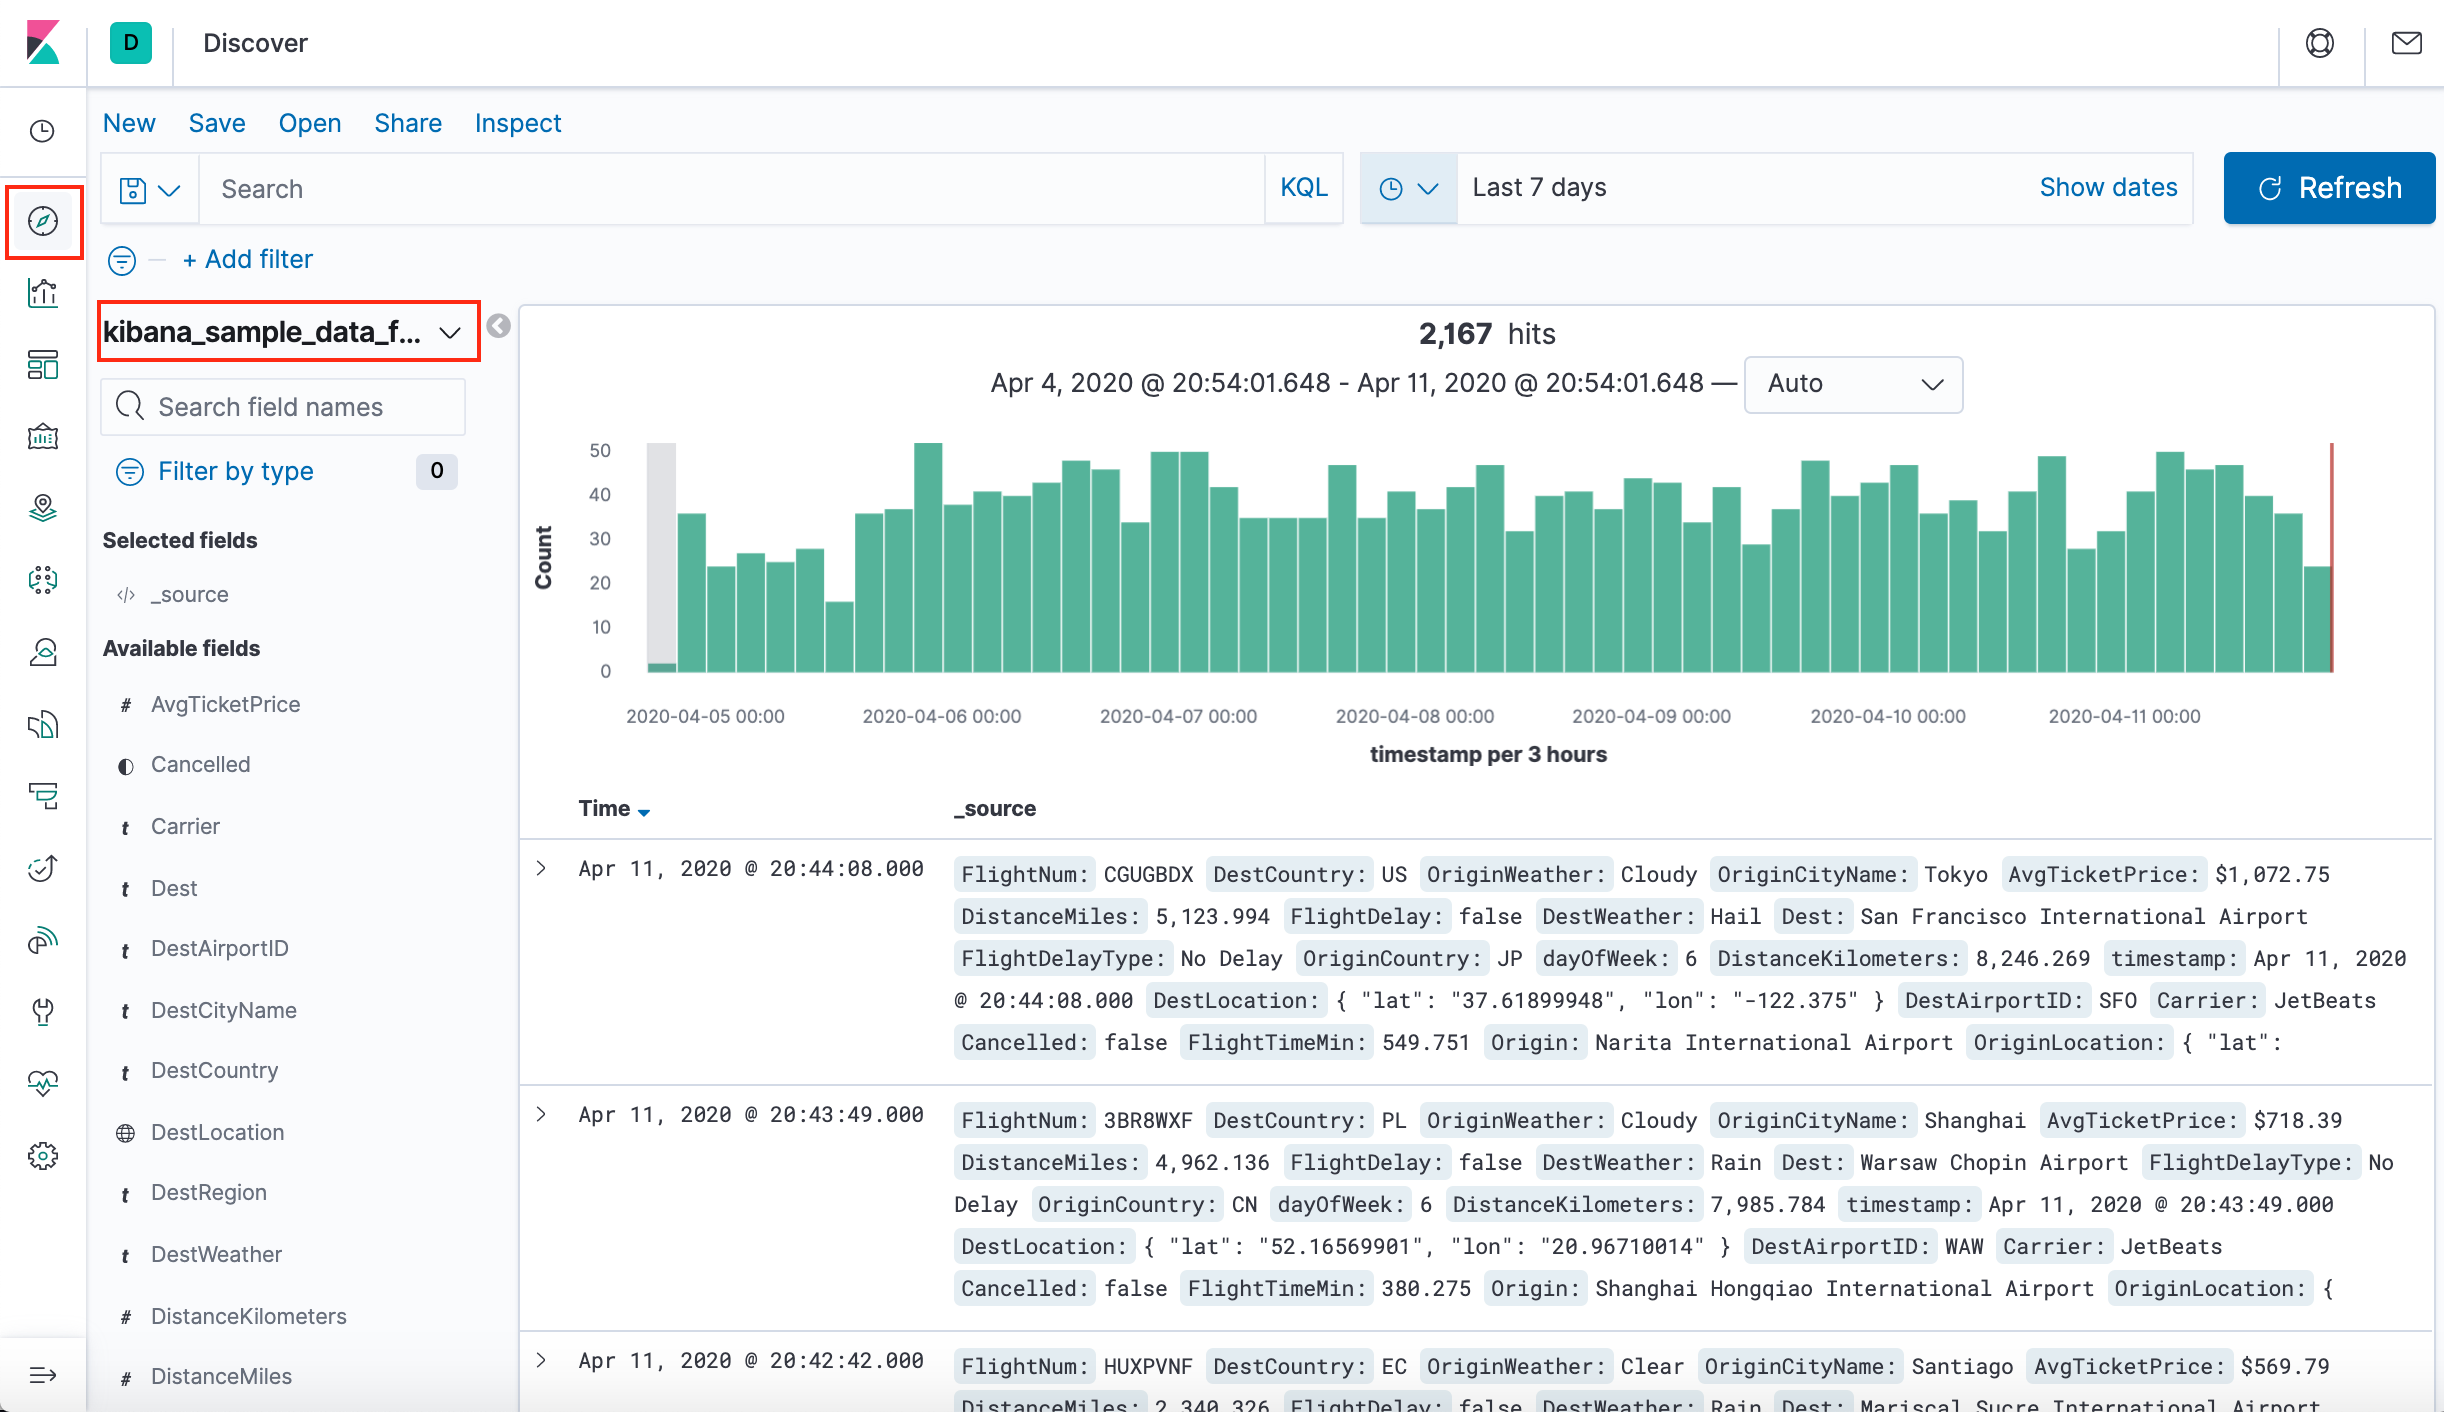
In Discover, we have access to every document in every index that matches the selected index pattern. The index pattern tells Kibana which Elasticsearch index we are currently exploring. We can submit search queries, filter the search results, and view document data.
- In the side navigation, click Discover.
- Ensure kibana_sample_data_flights is the current index pattern. We might need to click New in the menu bar to refresh the data.
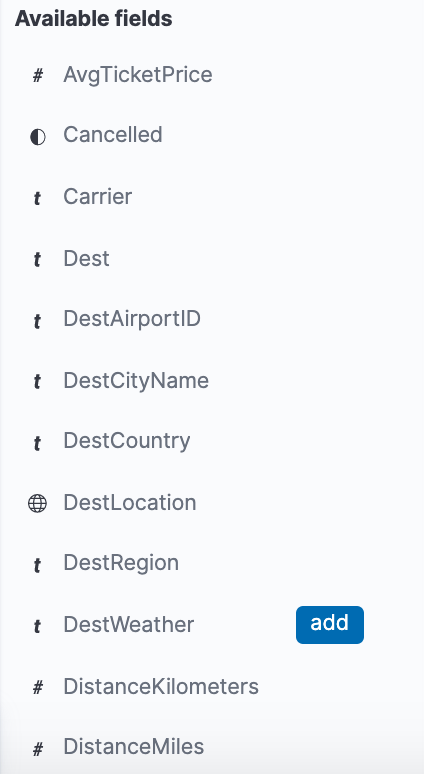
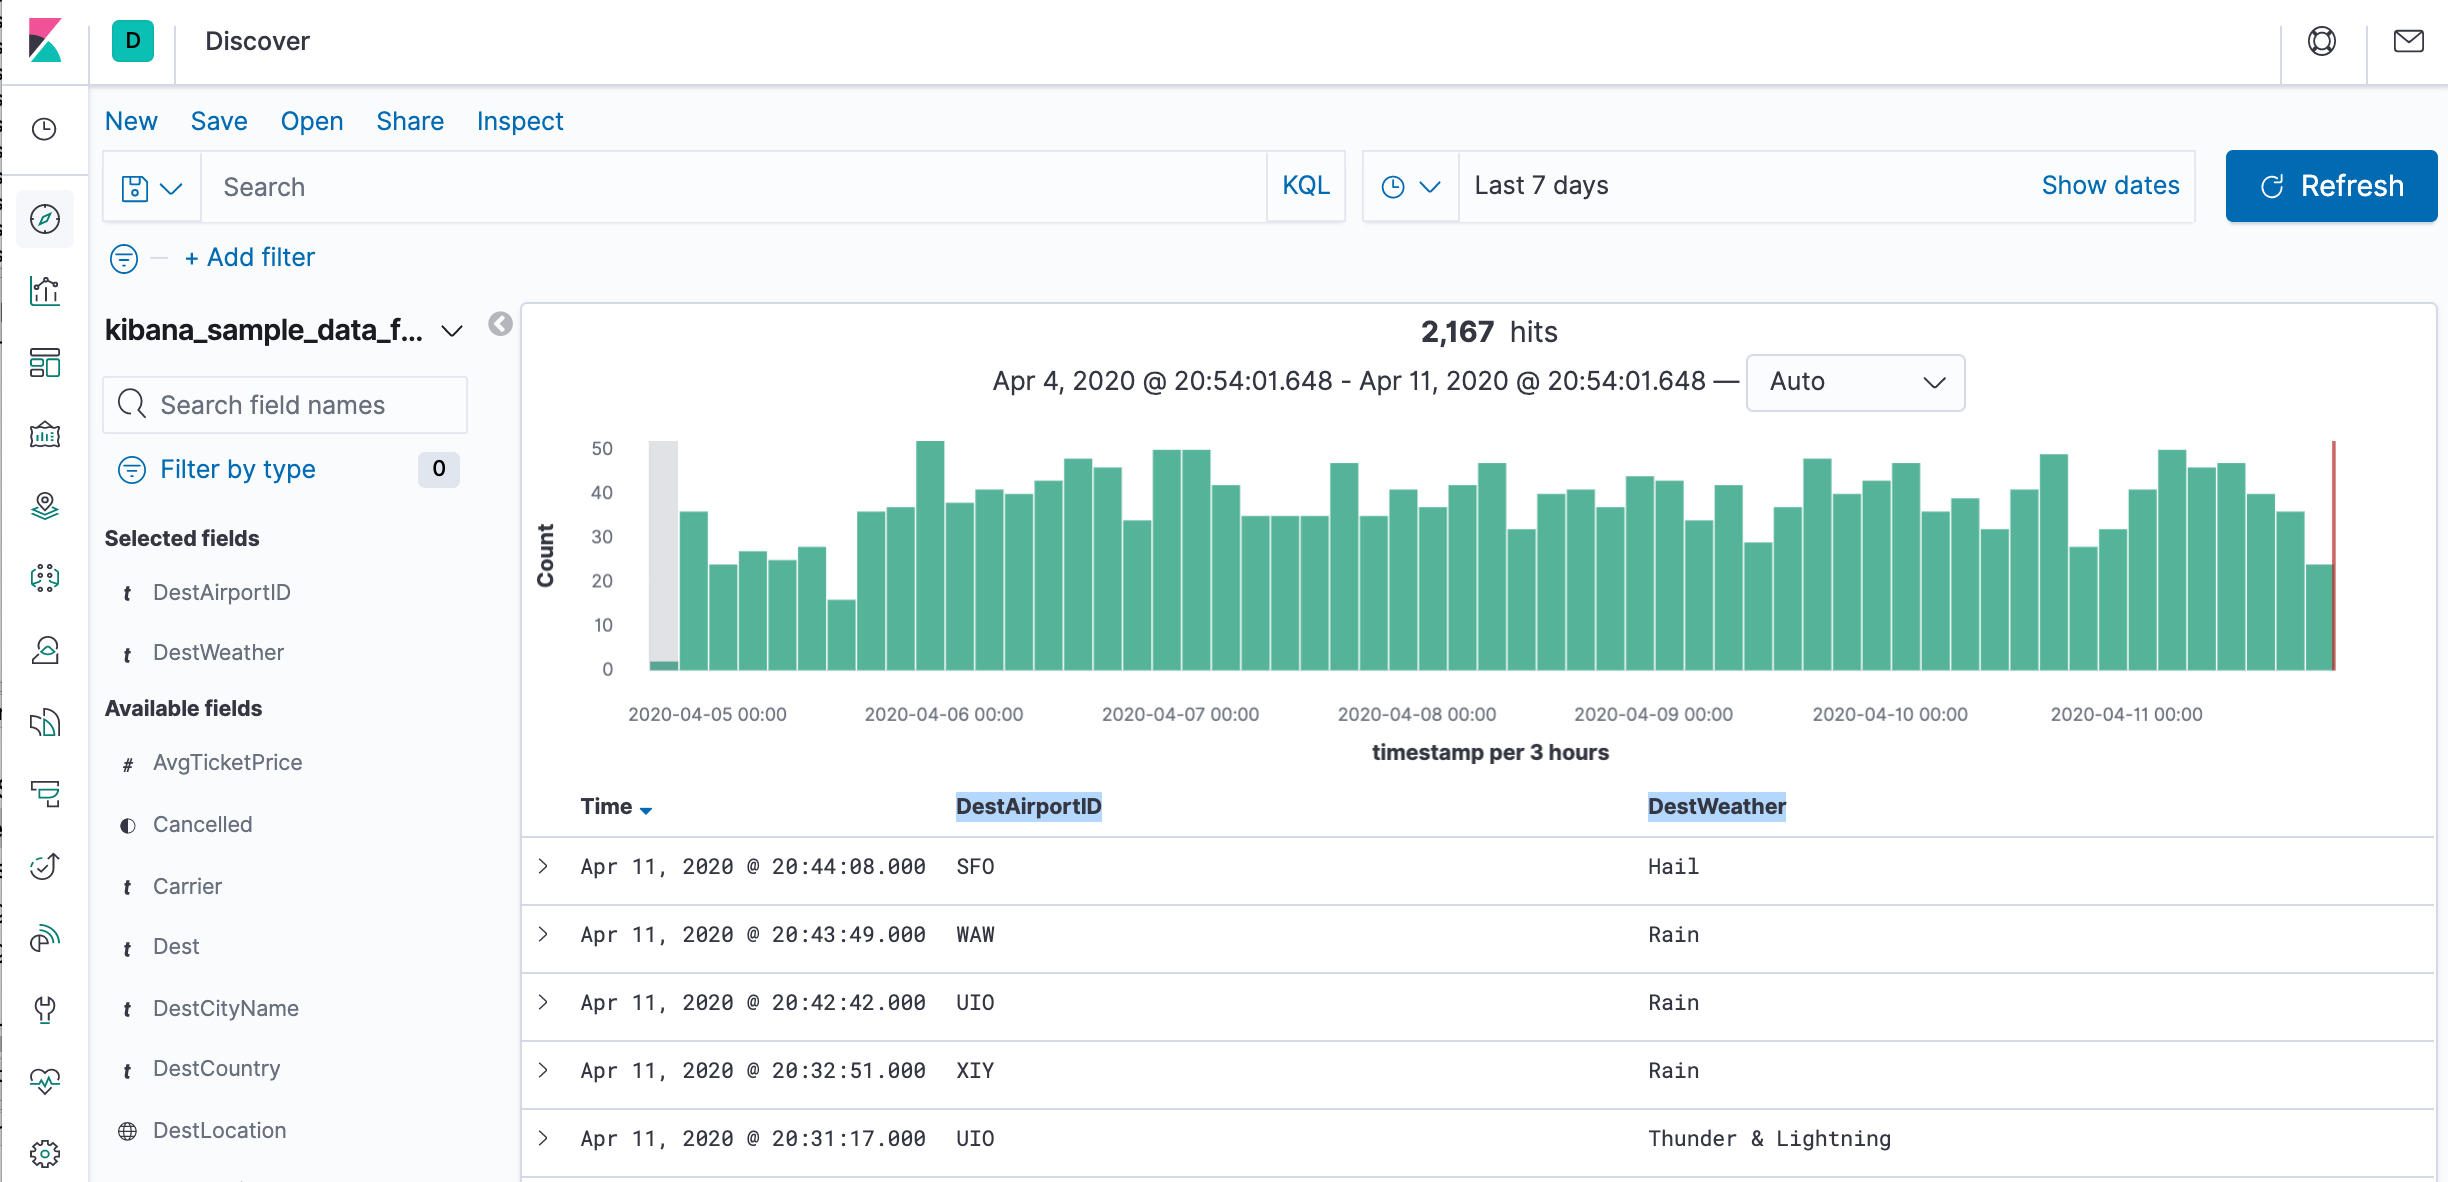
- To choose which fields to display, hover the pointer over the list of Available fields, and then click add next to each field we want include as a column in the table. For example, if we add the DestAirportID and DestWeather fields, the display includes columns for those two fields.
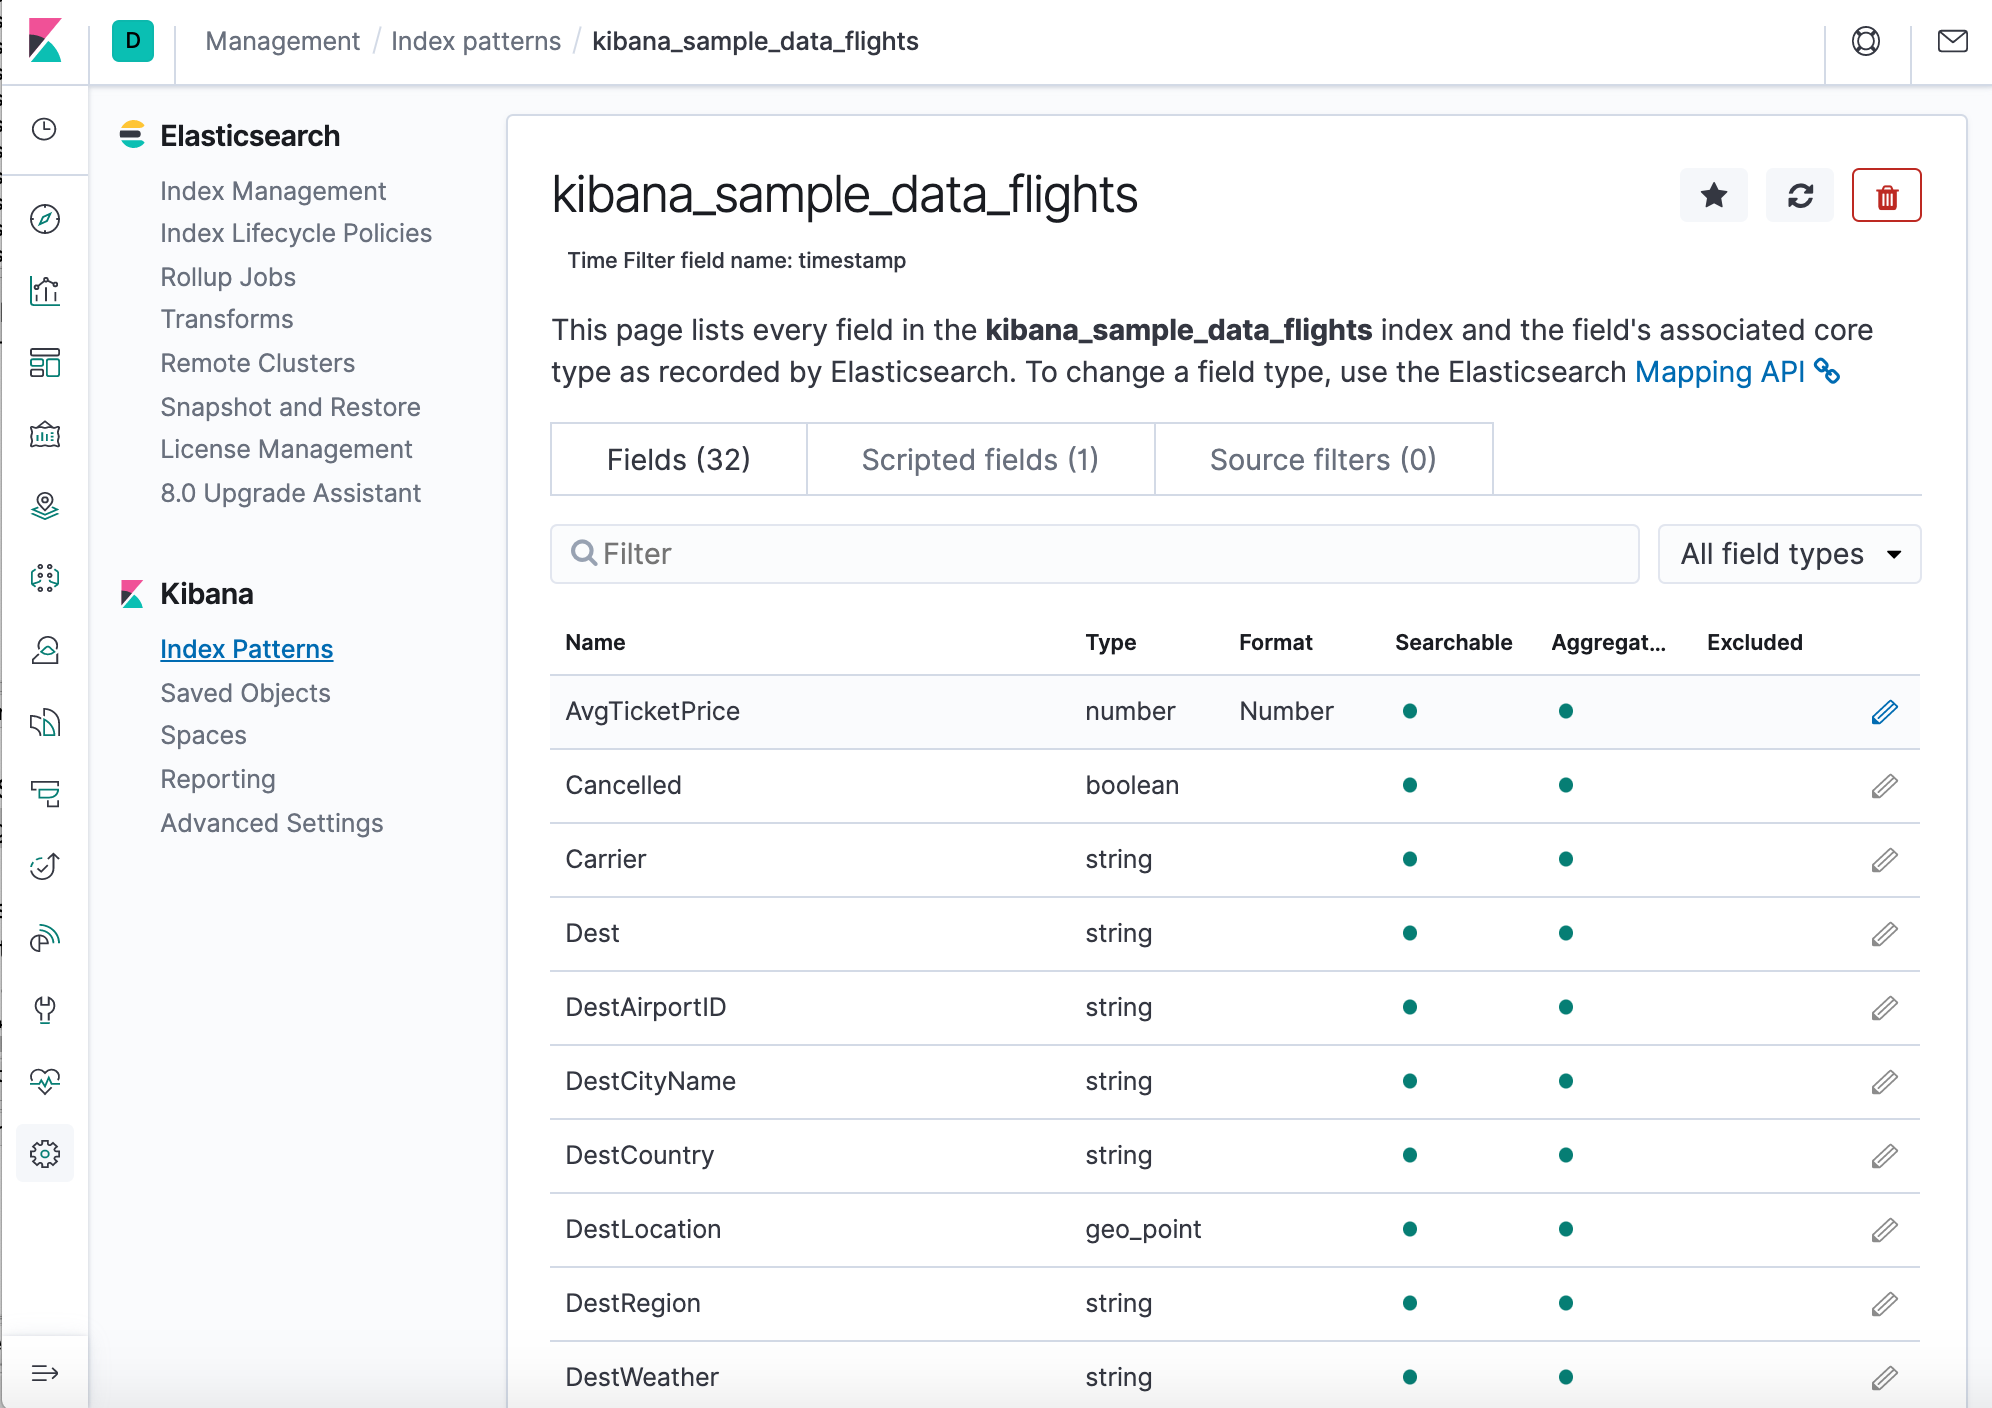
We can see a histogram that shows the distribution of documents over time. A table lists the fields for each matching document. By default, all fields are shown.
We have edit permissions for the Global Flight dashboard, so we can change the appearance and behavior of the visualizations. For example, we might want to see which airline has the lowest average fares.
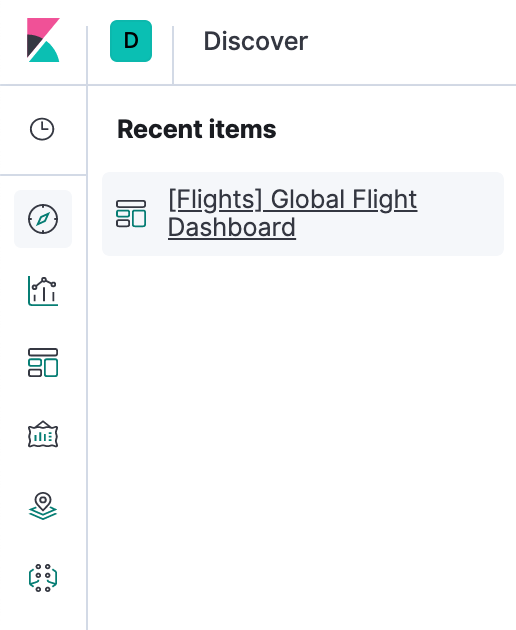
- In the side navigation, click Recently viewed and open the Global Flight Dashboard.
- In the menu bar, click Edit.
- In the Average Ticket Price visualization, click the gear icon in the upper right.
- From the Options menu, select Edit visualization.
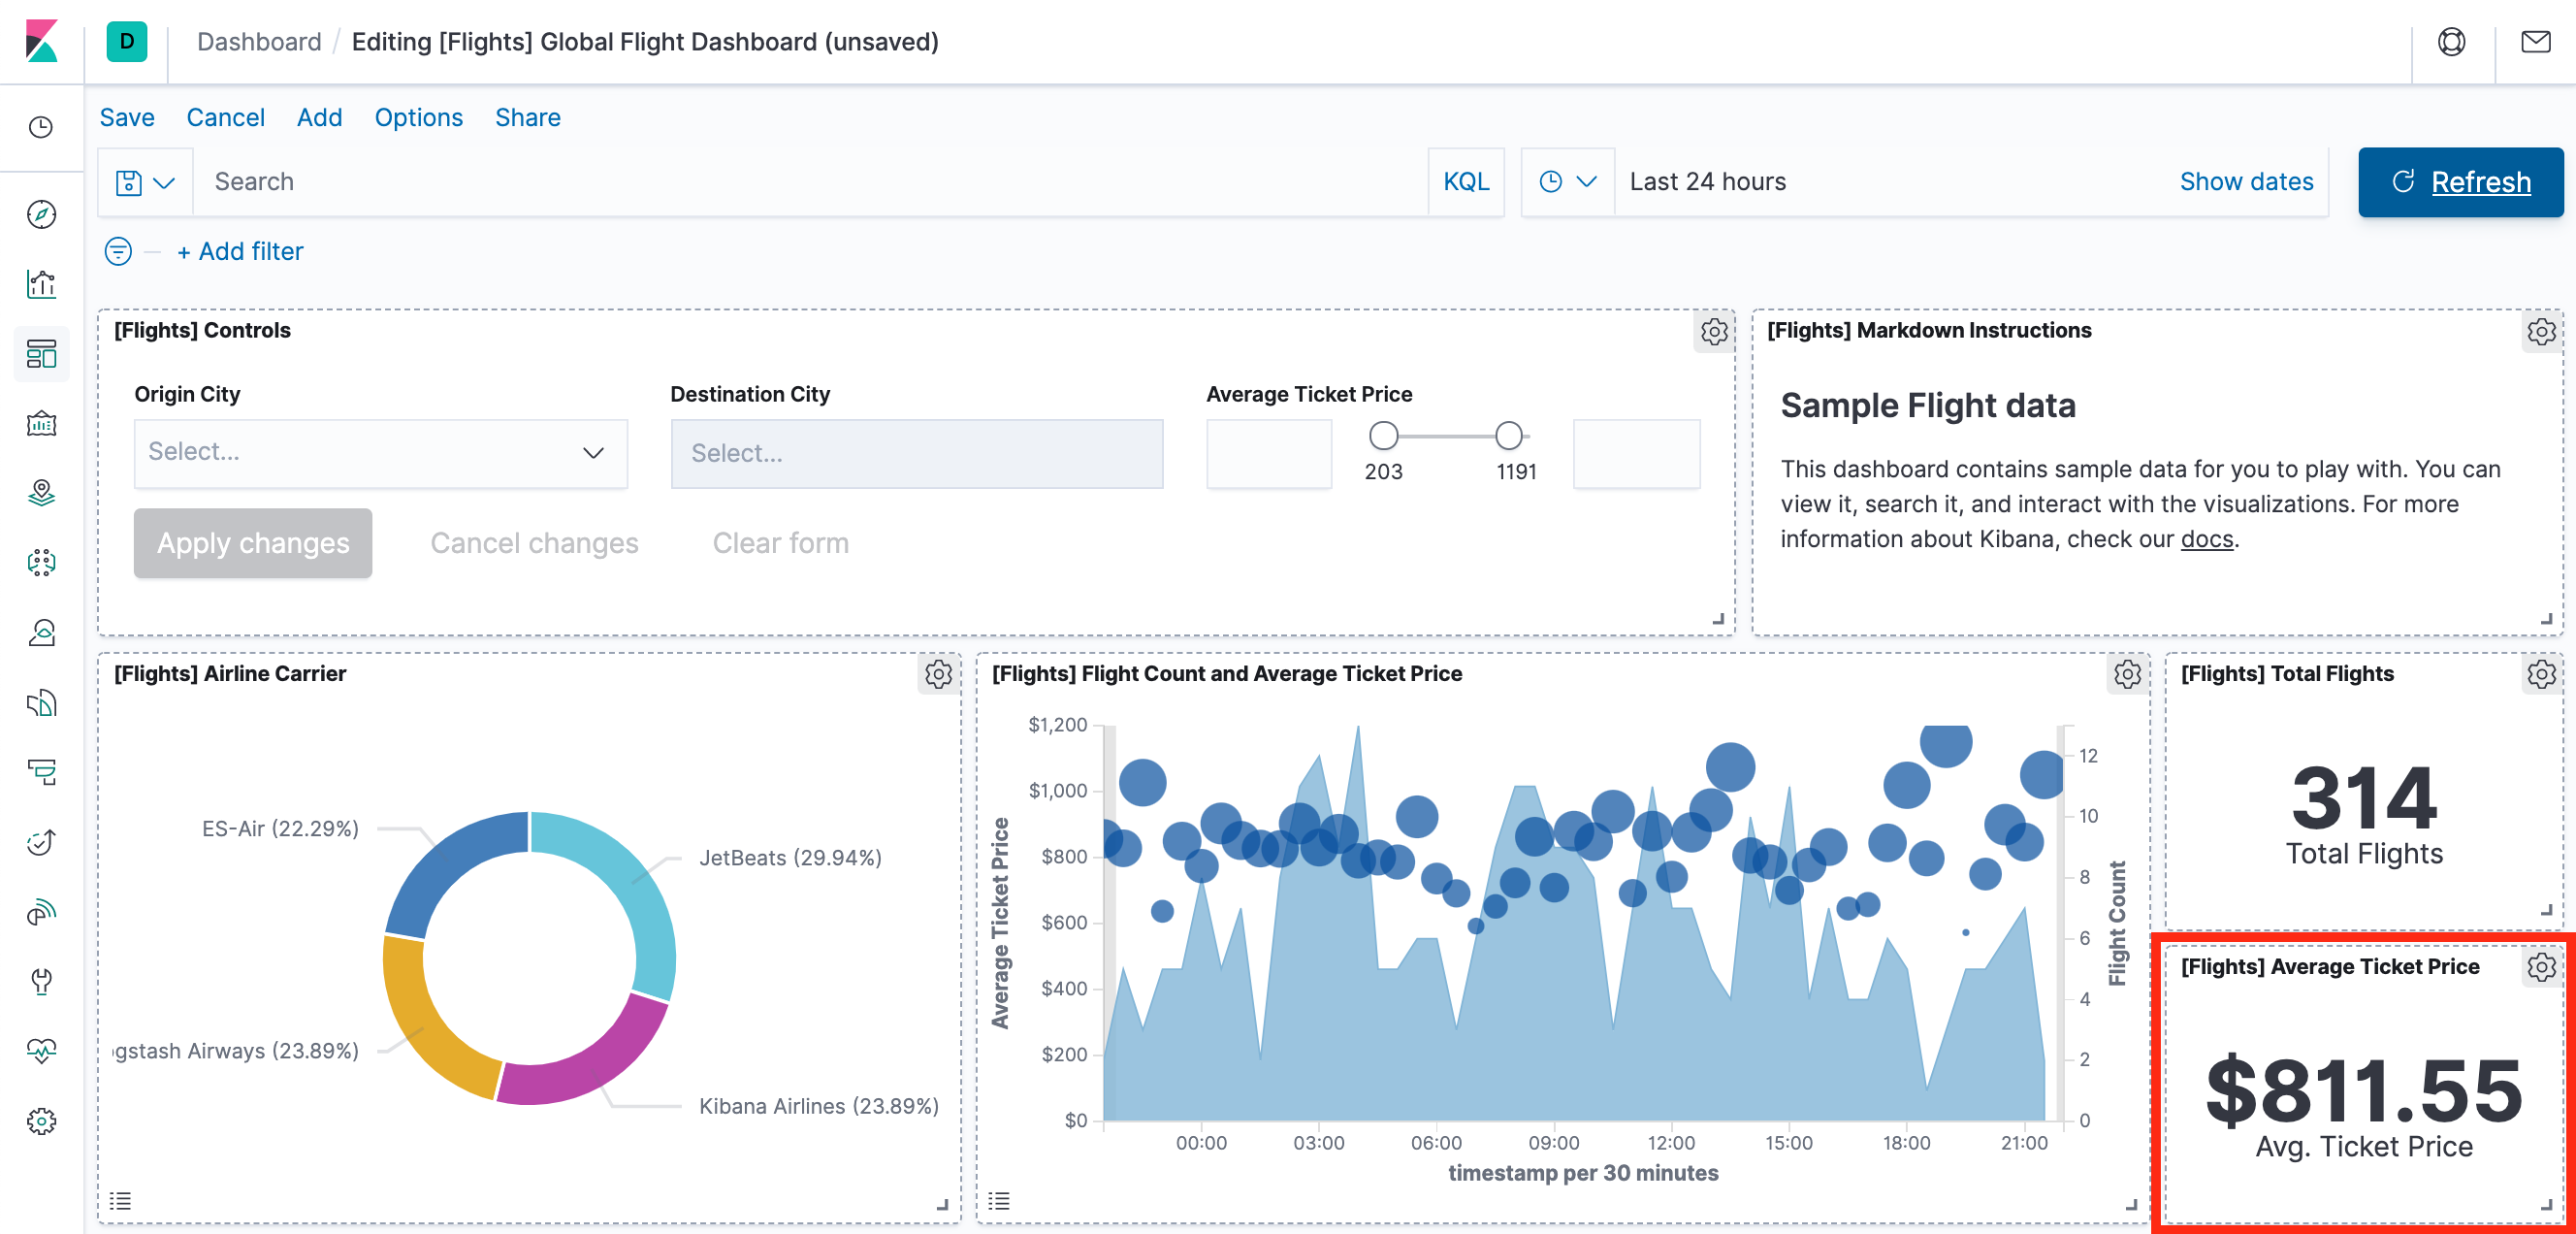
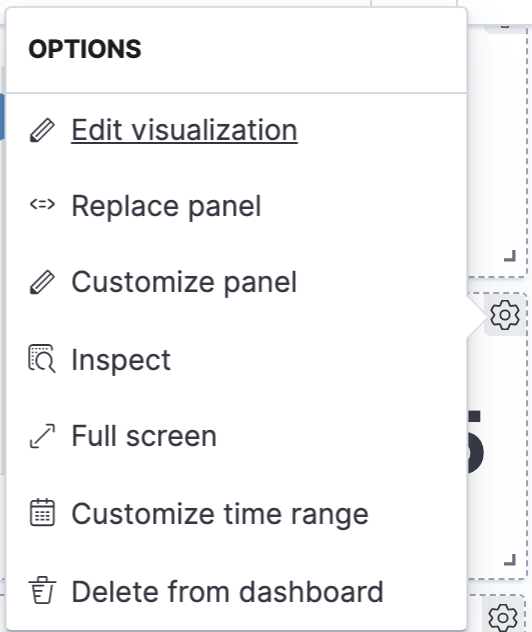
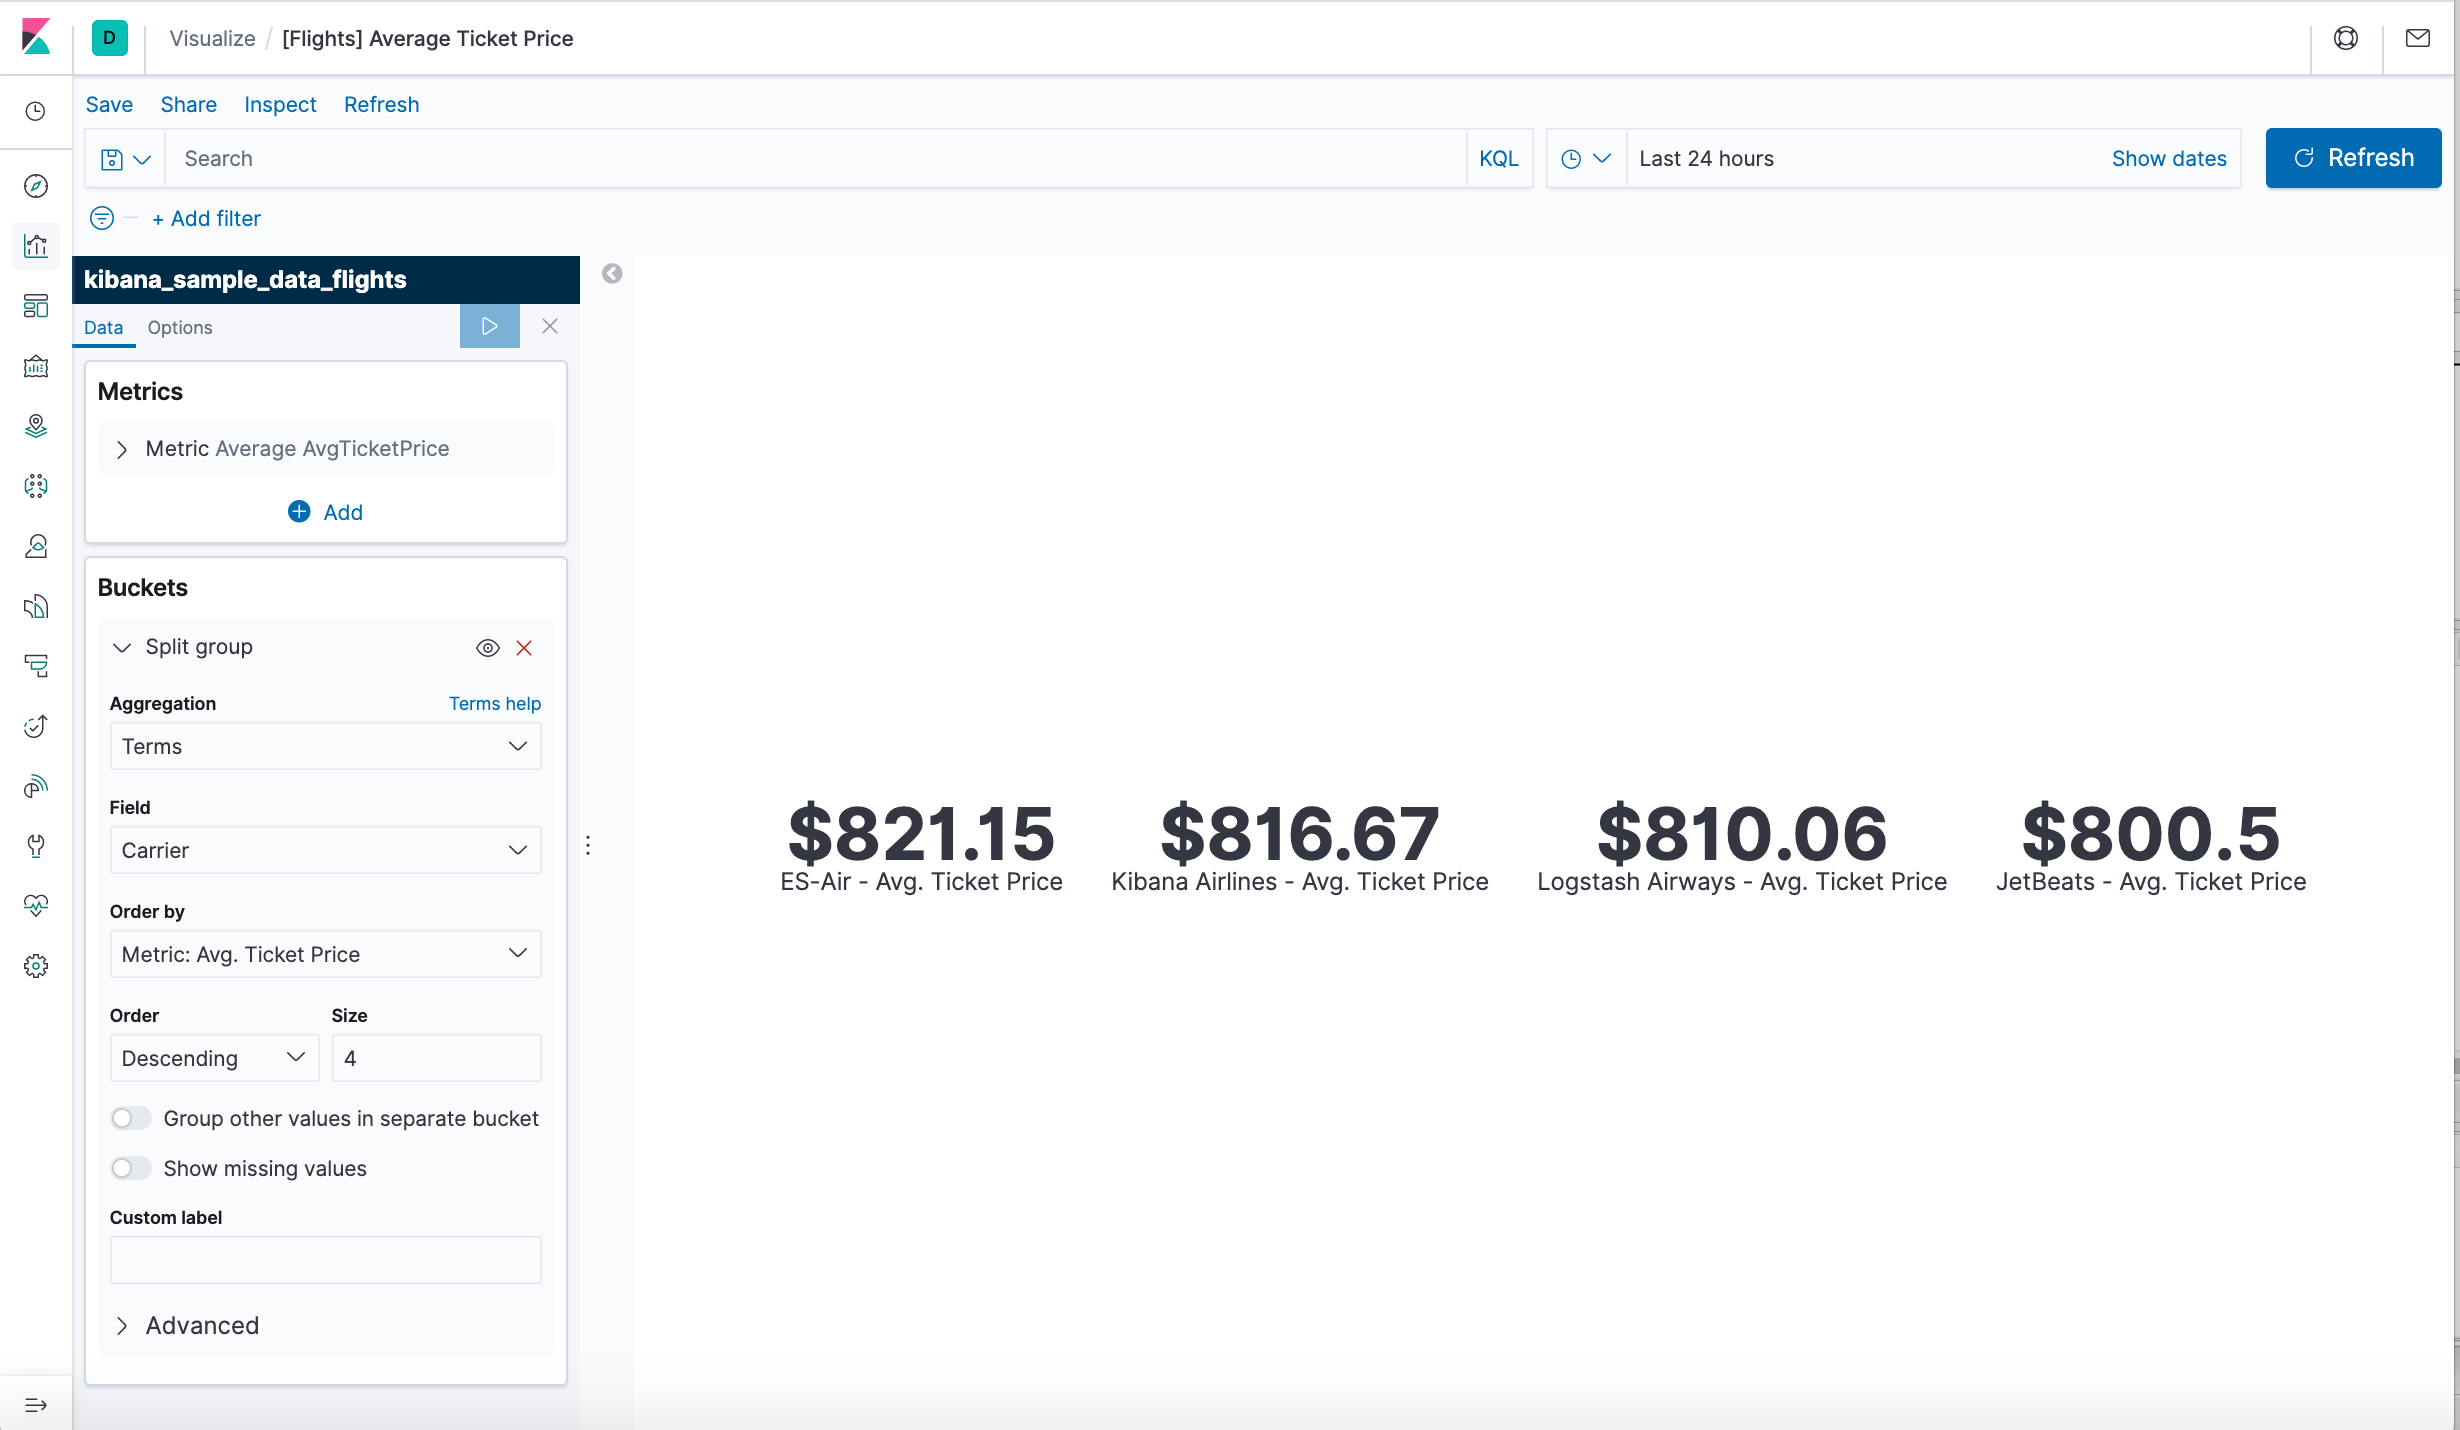
Average Ticket Price is a metric visualization. To specify which groups to display in this visualization, we use an Elasticsearch bucket aggregation. This aggregation sorts the documents that match our search criteria into different categories, or buckets.
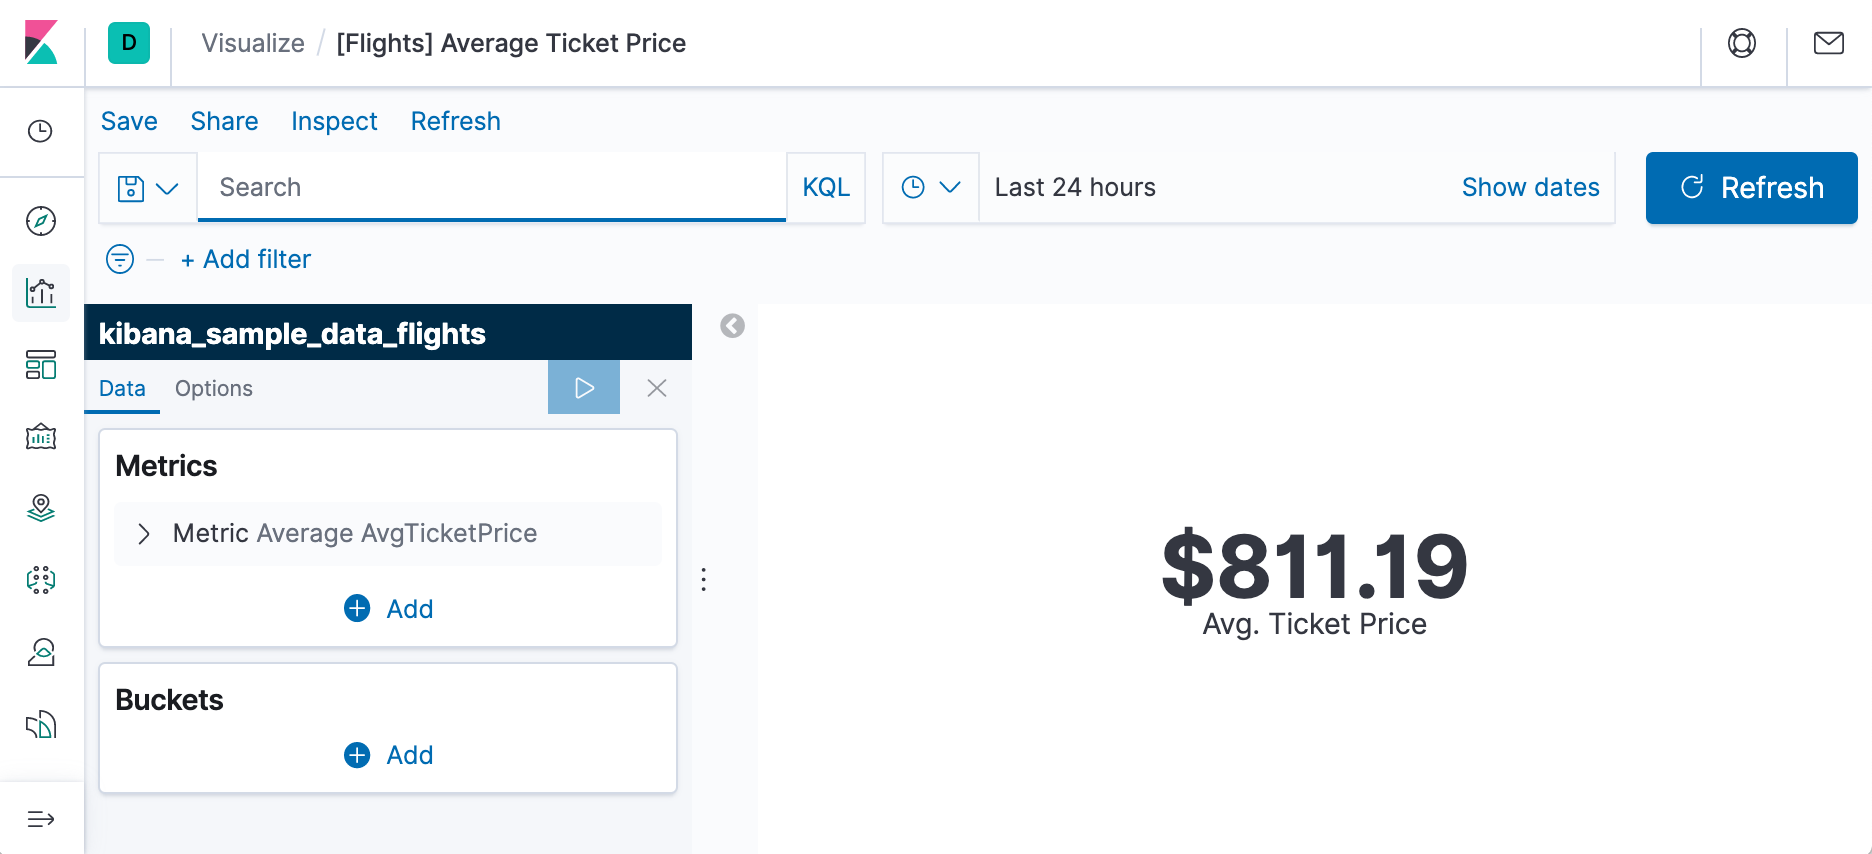
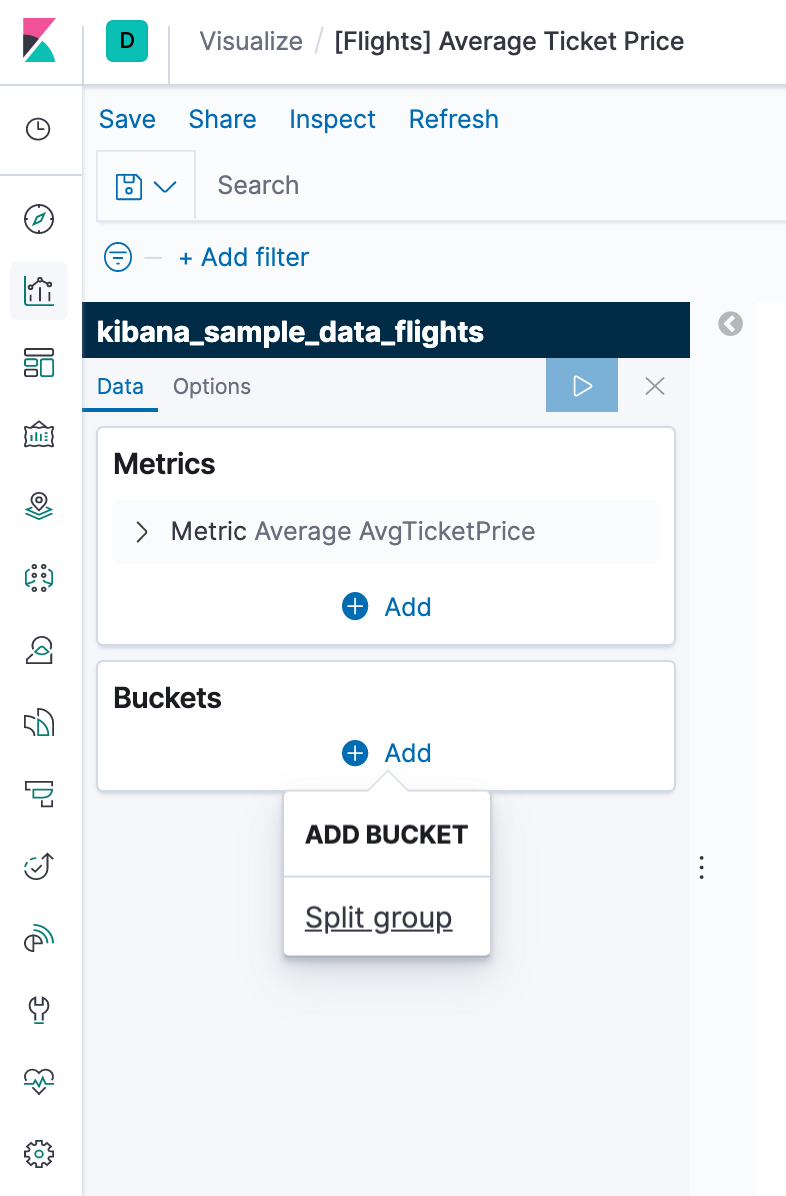
- In the Buckets pane, select Add > Split group.
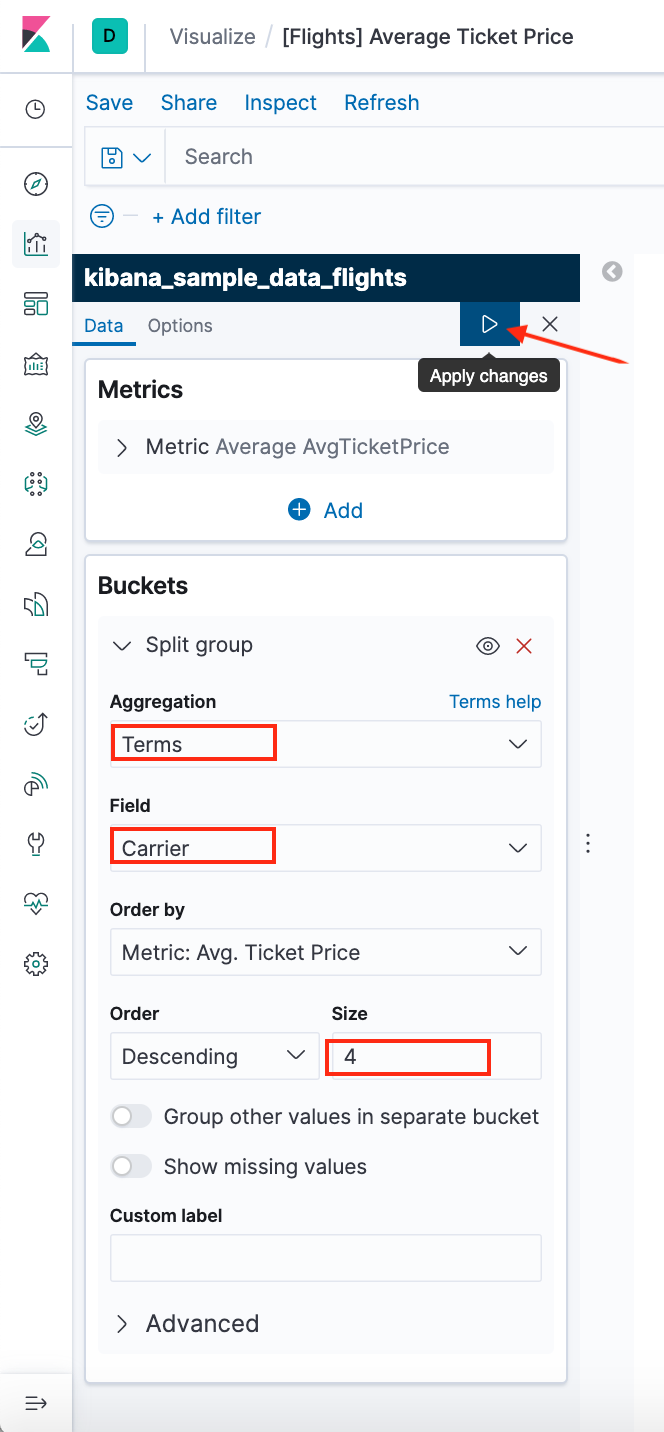
- In the Aggregation dropdown, select Terms.
- In the Field dropdown, select Carrier.
- Set Descending to 4.
- Click Apply changes apply changes button.
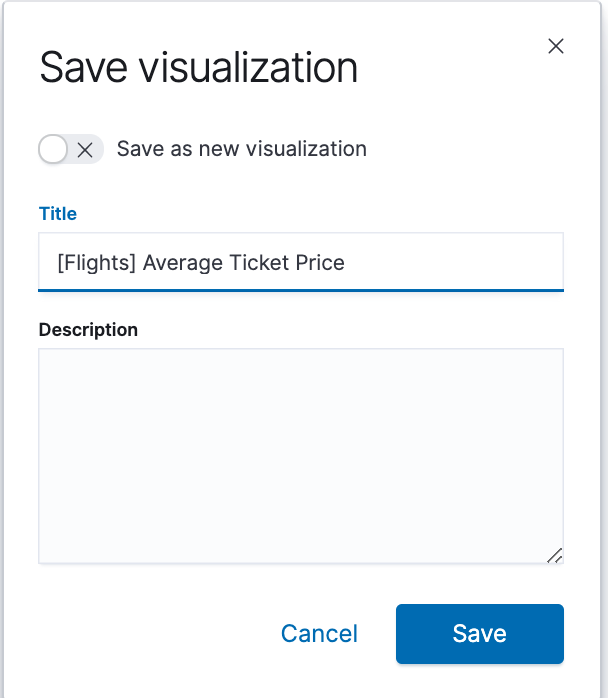
- In the menu bar, click Save.
- Leave the visualization name as is and confirm the save.
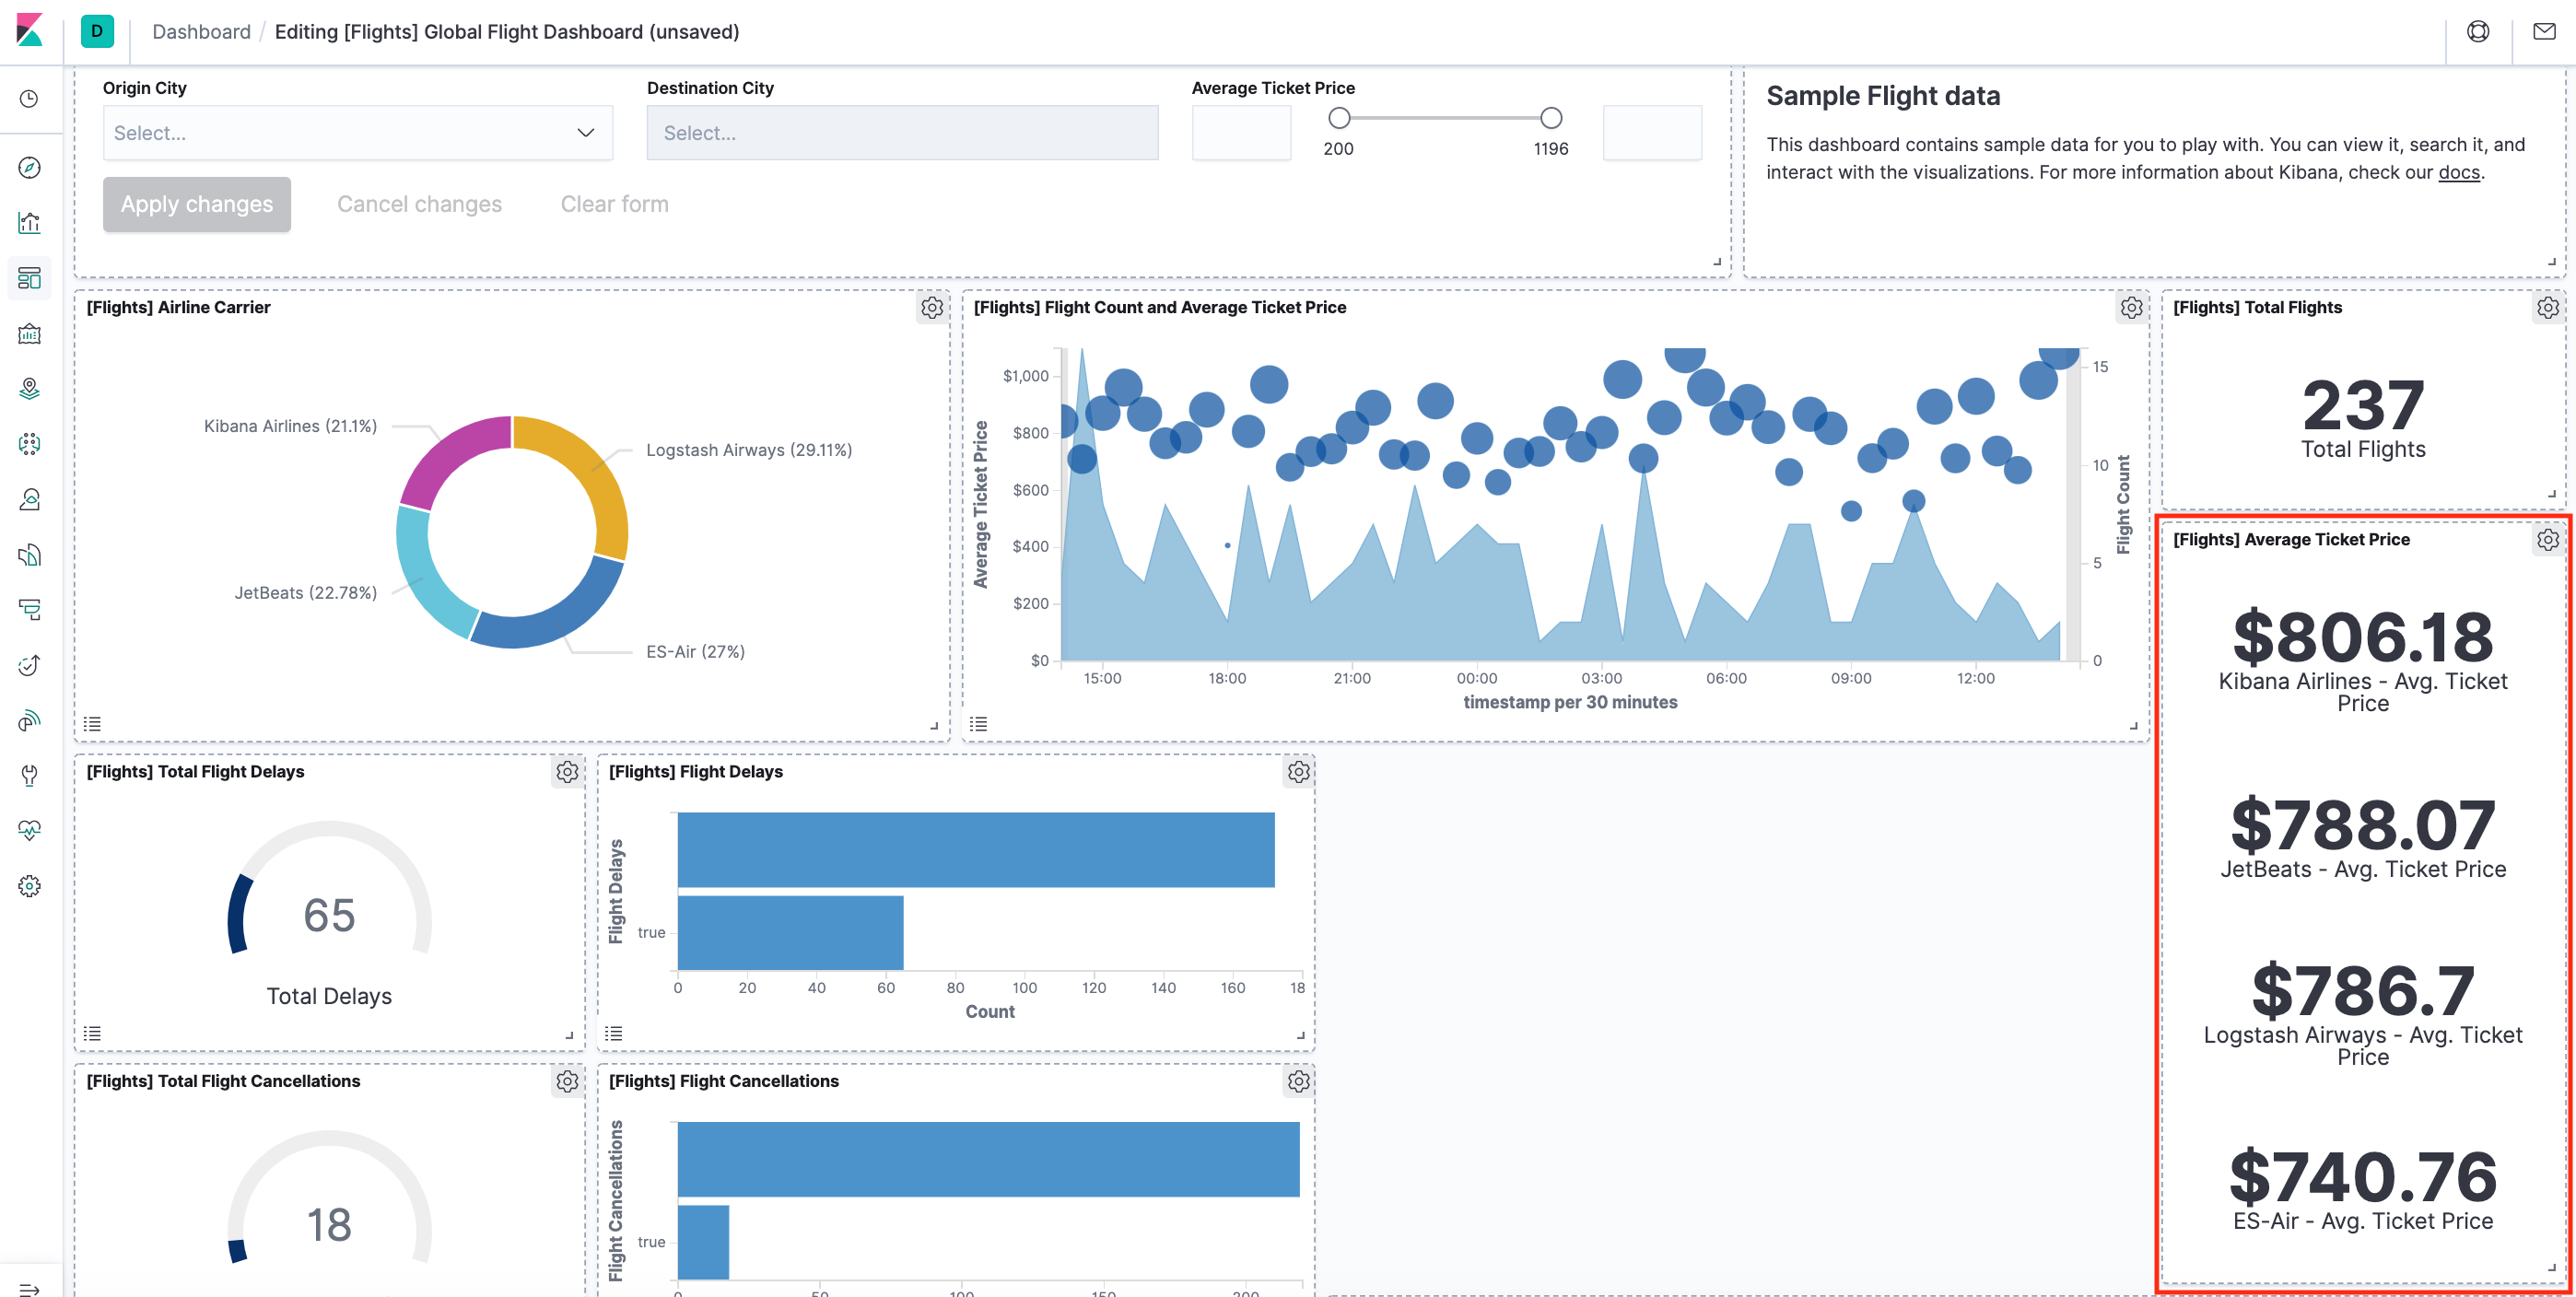
- Go to the Global Flight dashboard and scroll the Average Ticket Price visualization to see the four prices.
- Optionally, edit the dashboard. Resize the panel for the Average Ticket Price visualization by dragging the handle in the lower right. We can also rearrange the visualizations by clicking the header and dragging. Be sure to save the dashboard.
Seeing visualizations of our data is great, but sometimes we need to look at the actual data to understand what's really going on. We can inspect the data behind any visualization and view the Elasticsearch query used to retrieve it.
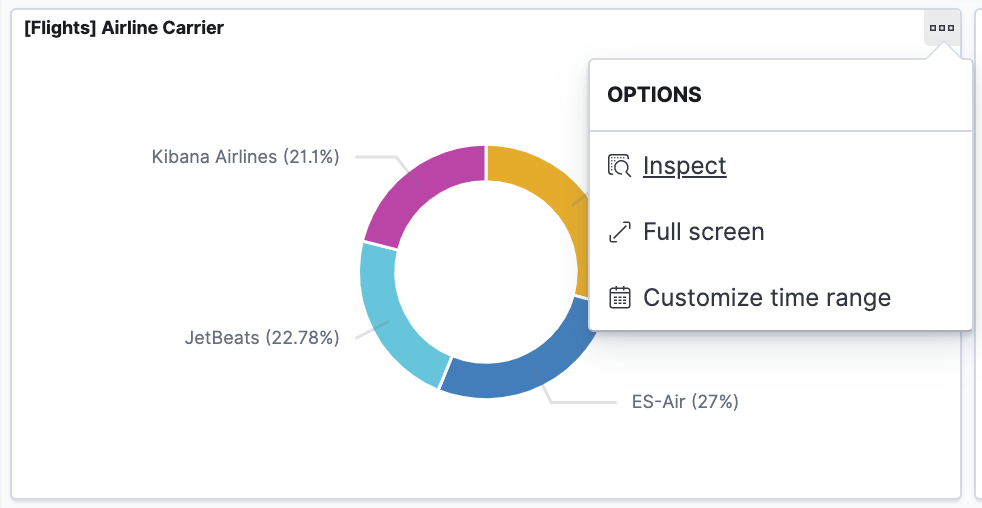
- In the dashboard, hover the pointer over the pie chart, and then click the icon in the upper right.
- From the Options menu, select Inspect. The initial view shows the document count.
- To look at the query used to fetch the data for the visualization, select View > Requests in the upper right of the Inspect pane.
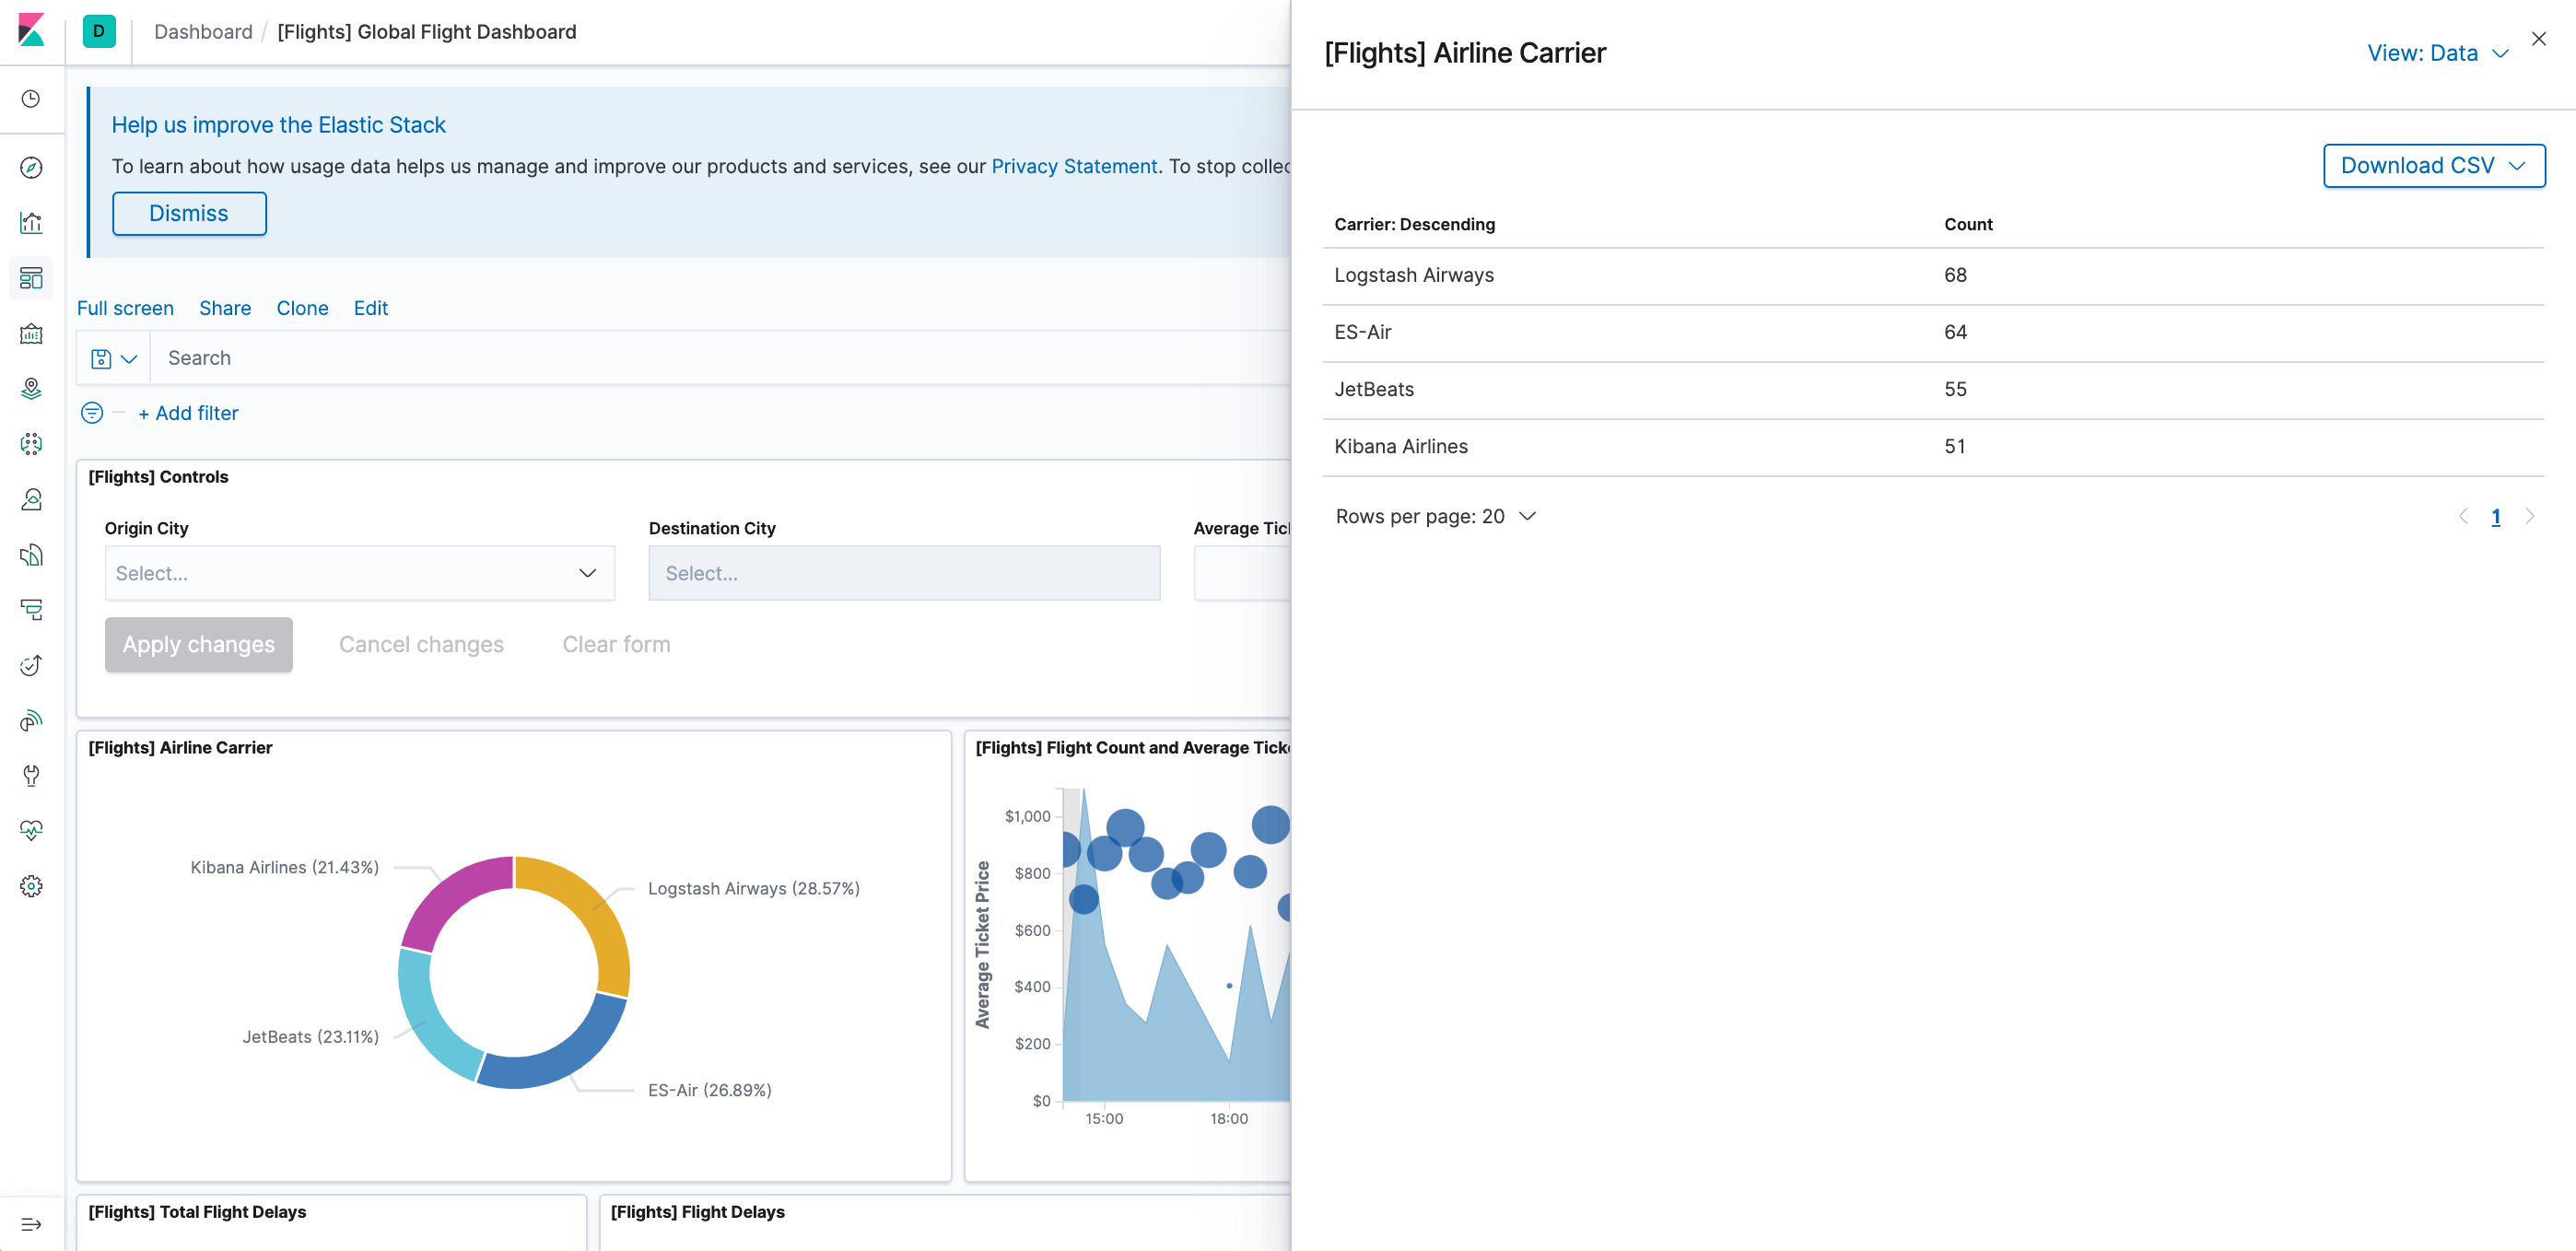
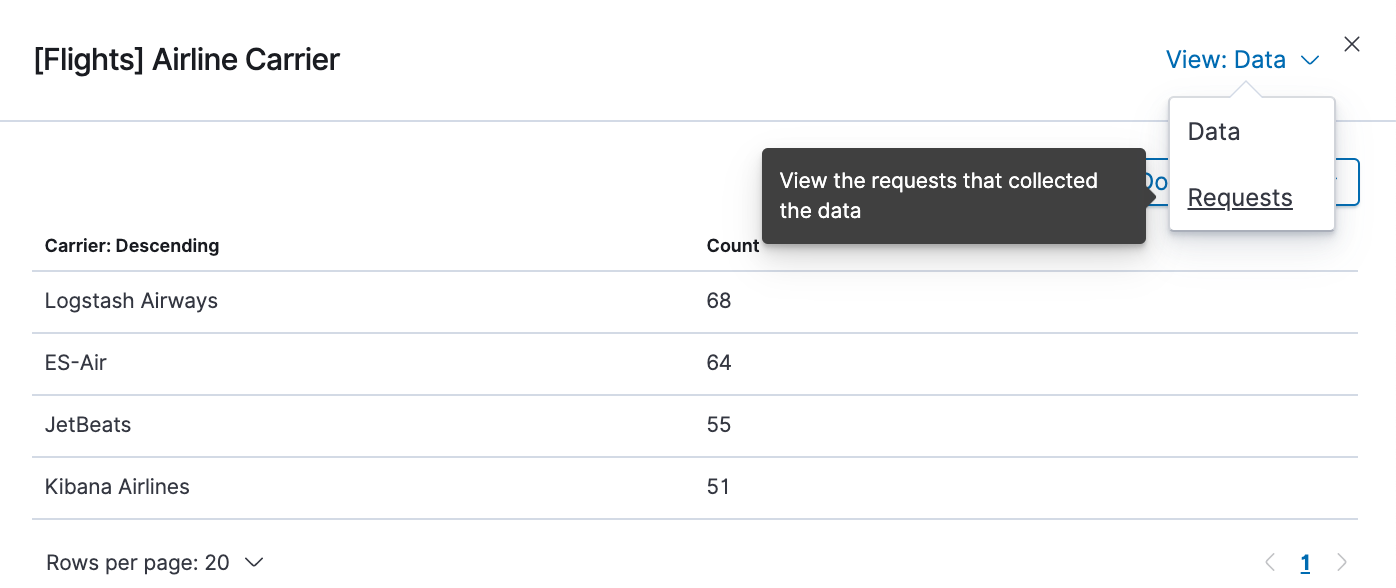
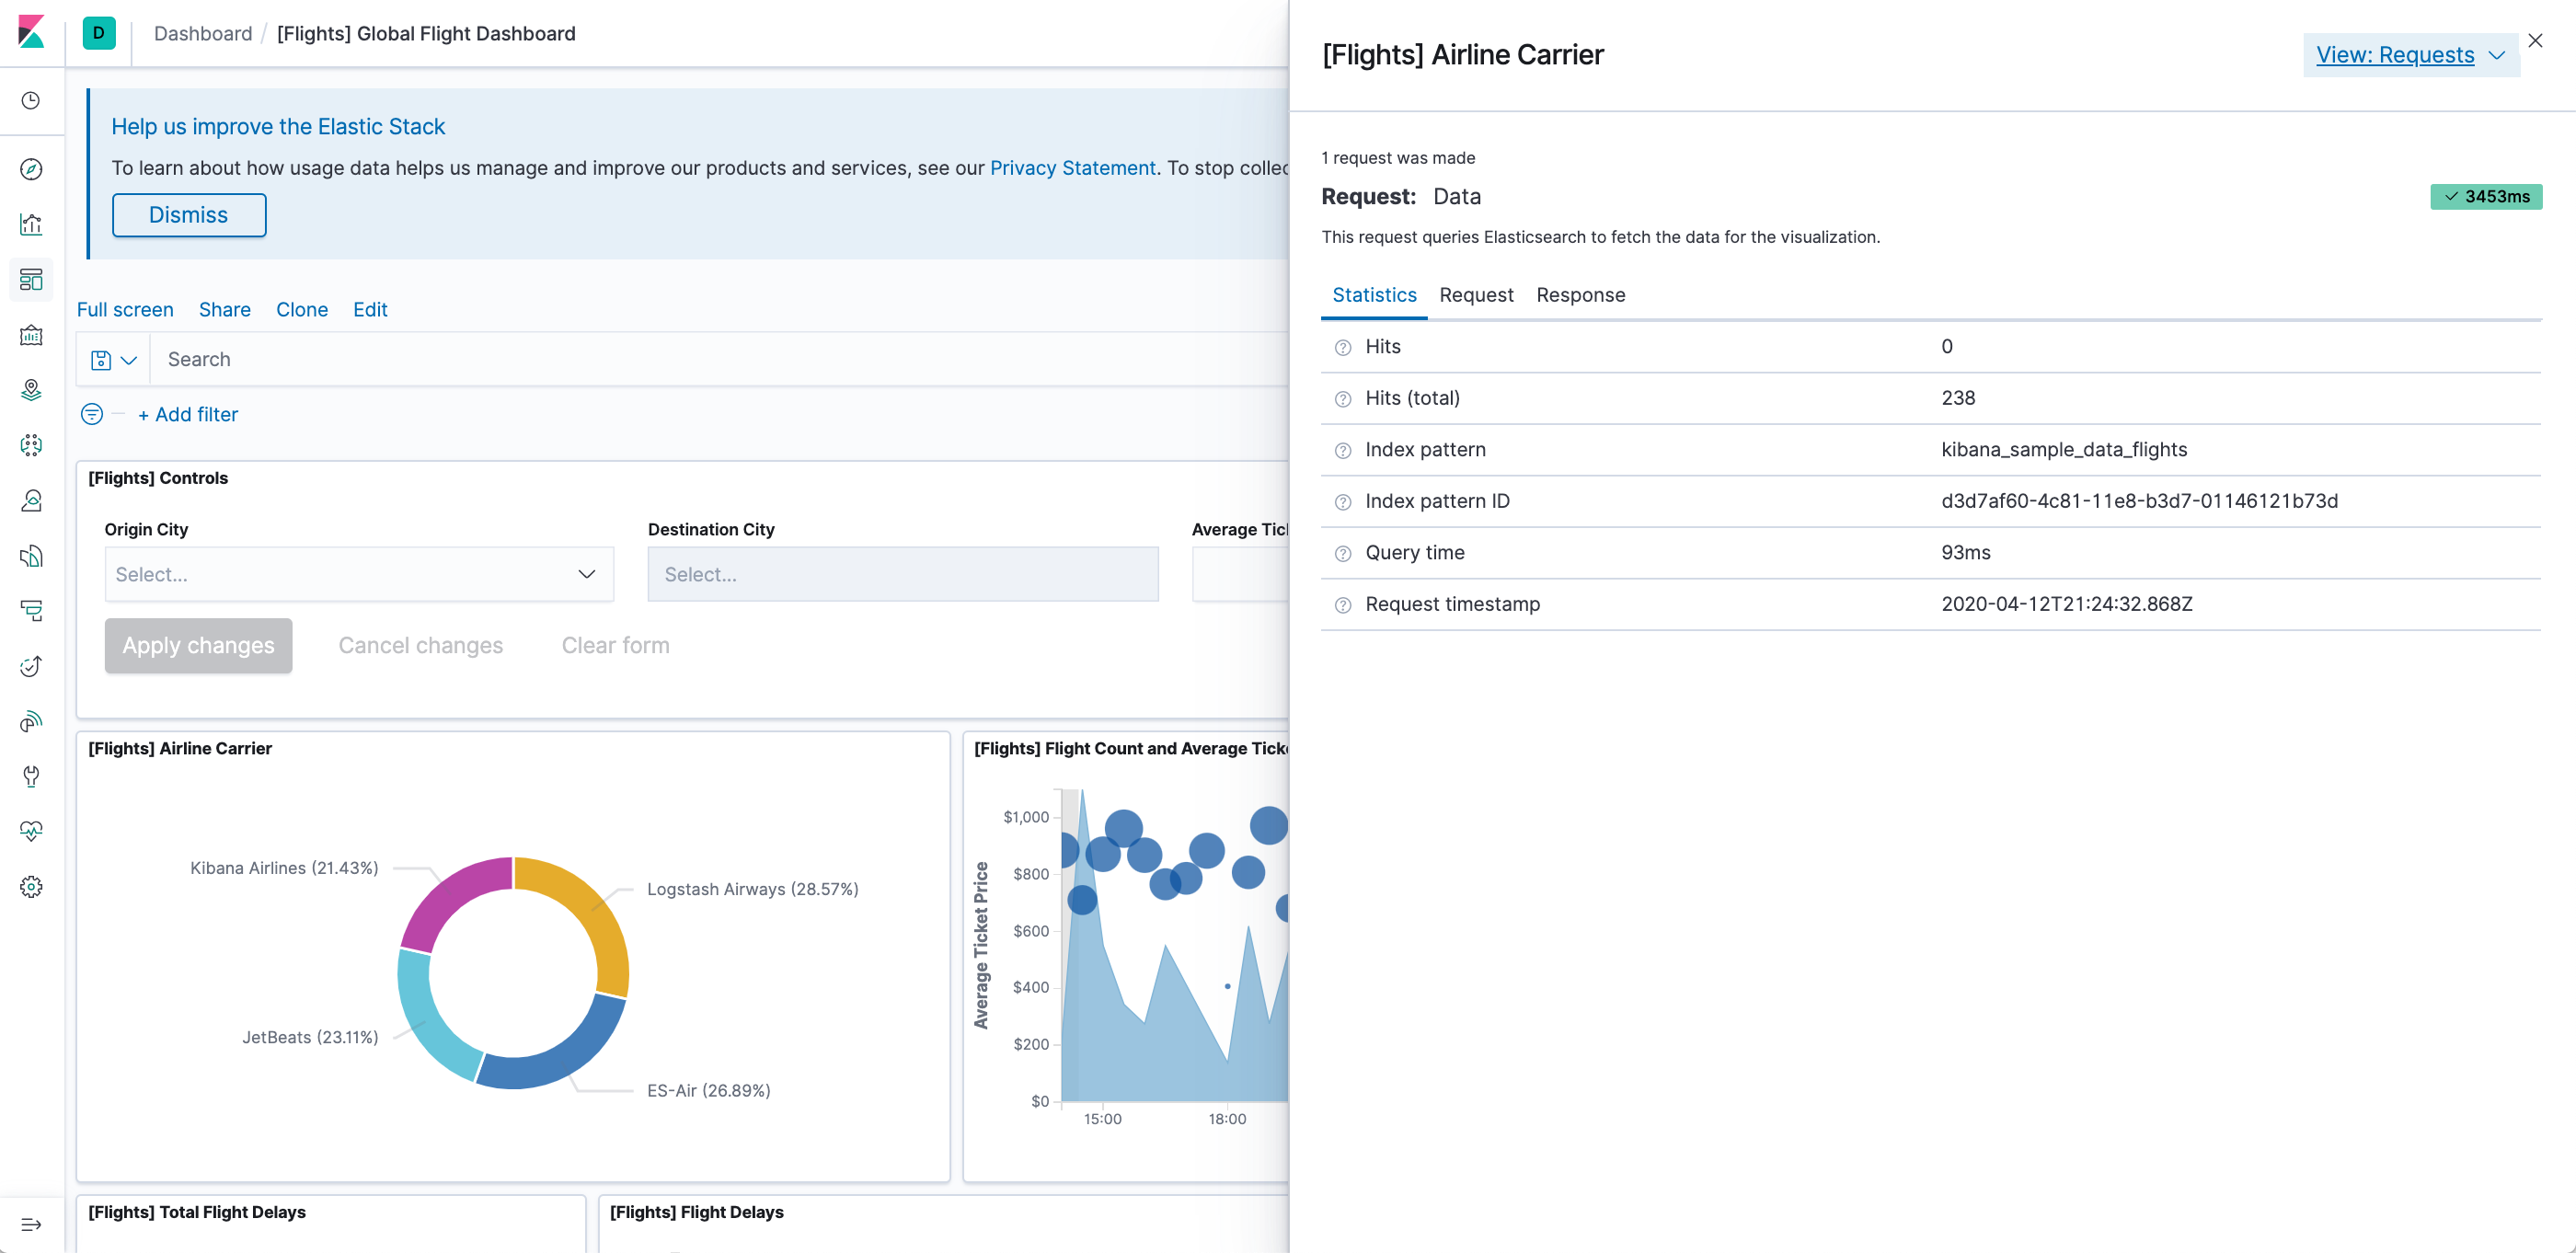
When we're done experimenting with the sample data set, we can remove it.
- Go to the Sample data page.
- On the Sample flight data card, click Remove.
Note: Continues to Docker - ELK 7.6 : Kibana on Centos 7 Part 2.
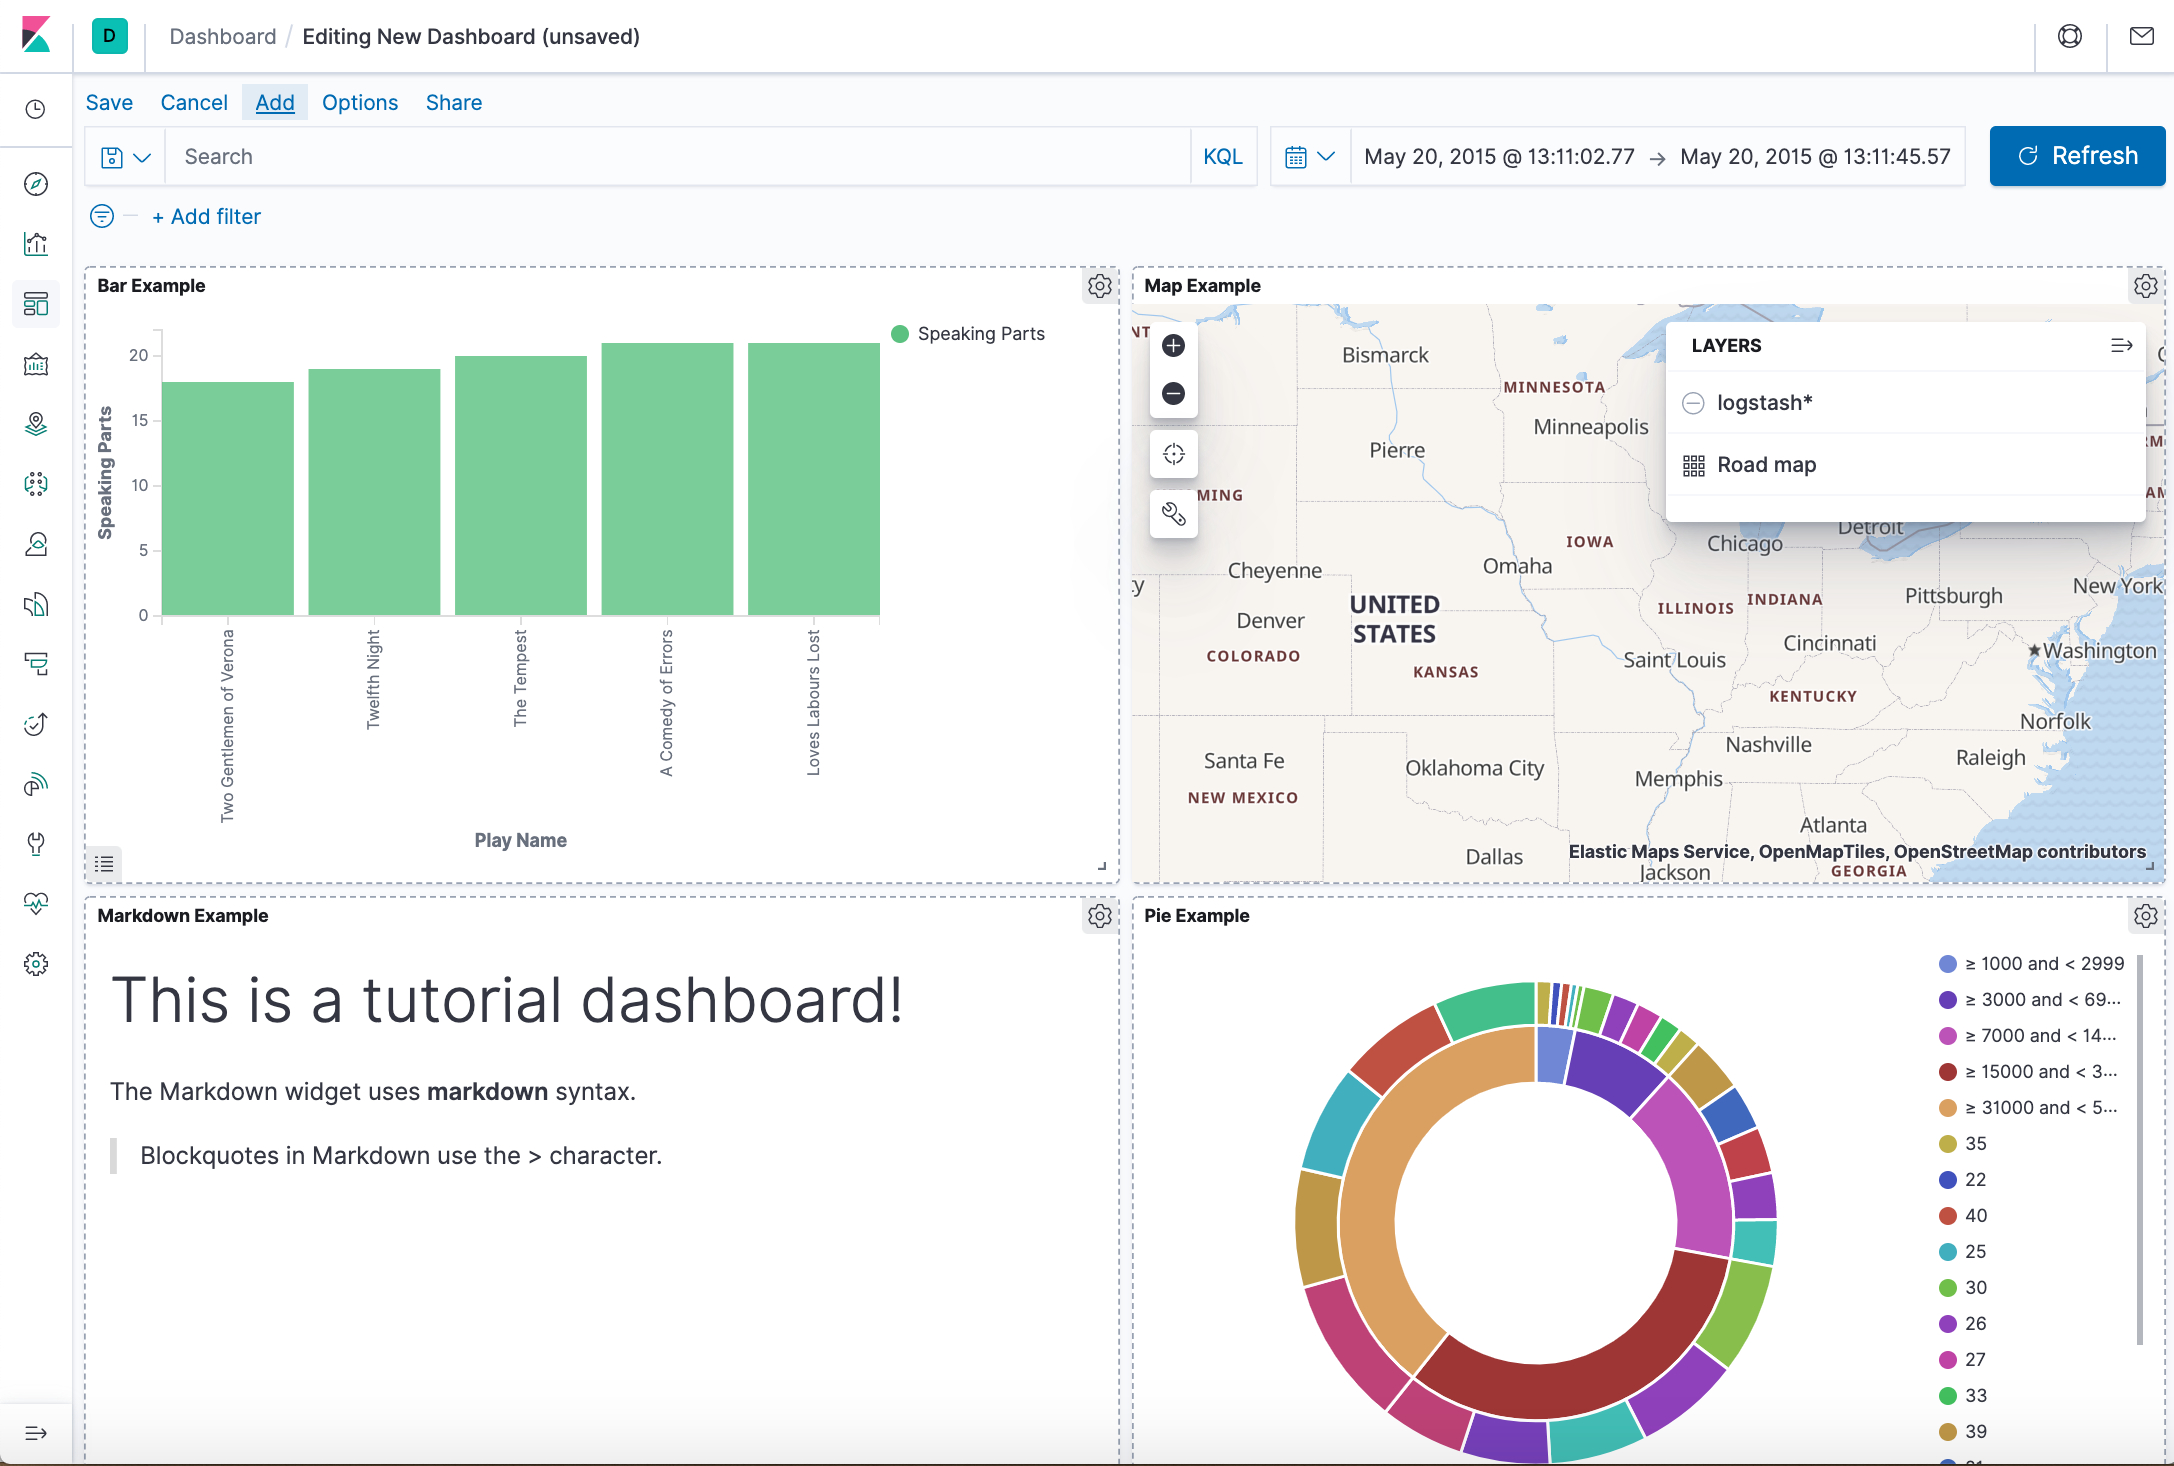
In the tutorial, we'll build our own dashboard composed of 4 visualization panels as the following:
Docker & K8s
- Docker install on Amazon Linux AMI
- Docker install on EC2 Ubuntu 14.04
- Docker container vs Virtual Machine
- Docker install on Ubuntu 14.04
- Docker Hello World Application
- Nginx image - share/copy files, Dockerfile
- Working with Docker images : brief introduction
- Docker image and container via docker commands (search, pull, run, ps, restart, attach, and rm)
- More on docker run command (docker run -it, docker run --rm, etc.)
- Docker Networks - Bridge Driver Network
- Docker Persistent Storage
- File sharing between host and container (docker run -d -p -v)
- Linking containers and volume for datastore
- Dockerfile - Build Docker images automatically I - FROM, MAINTAINER, and build context
- Dockerfile - Build Docker images automatically II - revisiting FROM, MAINTAINER, build context, and caching
- Dockerfile - Build Docker images automatically III - RUN
- Dockerfile - Build Docker images automatically IV - CMD
- Dockerfile - Build Docker images automatically V - WORKDIR, ENV, ADD, and ENTRYPOINT
- Docker - Apache Tomcat
- Docker - NodeJS
- Docker - NodeJS with hostname
- Docker Compose - NodeJS with MongoDB
- Docker - Prometheus and Grafana with Docker-compose
- Docker - StatsD/Graphite/Grafana
- Docker - Deploying a Java EE JBoss/WildFly Application on AWS Elastic Beanstalk Using Docker Containers
- Docker : NodeJS with GCP Kubernetes Engine
- Docker : Jenkins Multibranch Pipeline with Jenkinsfile and Github
- Docker : Jenkins Master and Slave
- Docker - ELK : ElasticSearch, Logstash, and Kibana
- Docker - ELK 7.6 : Elasticsearch on Centos 7
- Docker - ELK 7.6 : Filebeat on Centos 7
- Docker - ELK 7.6 : Logstash on Centos 7
- Docker - ELK 7.6 : Kibana on Centos 7
- Docker - ELK 7.6 : Elastic Stack with Docker Compose
- Docker - Deploy Elastic Cloud on Kubernetes (ECK) via Elasticsearch operator on minikube
- Docker - Deploy Elastic Stack via Helm on minikube
- Docker Compose - A gentle introduction with WordPress
- Docker Compose - MySQL
- MEAN Stack app on Docker containers : micro services
- MEAN Stack app on Docker containers : micro services via docker-compose
- Docker Compose - Hashicorp's Vault and Consul Part A (install vault, unsealing, static secrets, and policies)
- Docker Compose - Hashicorp's Vault and Consul Part B (EaaS, dynamic secrets, leases, and revocation)
- Docker Compose - Hashicorp's Vault and Consul Part C (Consul)
- Docker Compose with two containers - Flask REST API service container and an Apache server container
- Docker compose : Nginx reverse proxy with multiple containers
- Docker & Kubernetes : Envoy - Getting started
- Docker & Kubernetes : Envoy - Front Proxy
- Docker & Kubernetes : Ambassador - Envoy API Gateway on Kubernetes
- Docker Packer
- Docker Cheat Sheet
- Docker Q & A #1
- Kubernetes Q & A - Part I
- Kubernetes Q & A - Part II
- Docker - Run a React app in a docker
- Docker - Run a React app in a docker II (snapshot app with nginx)
- Docker - NodeJS and MySQL app with React in a docker
- Docker - Step by Step NodeJS and MySQL app with React - I
- Installing LAMP via puppet on Docker
- Docker install via Puppet
- Nginx Docker install via Ansible
- Apache Hadoop CDH 5.8 Install with QuickStarts Docker
- Docker - Deploying Flask app to ECS
- Docker Compose - Deploying WordPress to AWS
- Docker - WordPress Deploy to ECS with Docker-Compose (ECS-CLI EC2 type)
- Docker - WordPress Deploy to ECS with Docker-Compose (ECS-CLI Fargate type)
- Docker - ECS Fargate
- Docker - AWS ECS service discovery with Flask and Redis
- Docker & Kubernetes : minikube
- Docker & Kubernetes 2 : minikube Django with Postgres - persistent volume
- Docker & Kubernetes 3 : minikube Django with Redis and Celery
- Docker & Kubernetes 4 : Django with RDS via AWS Kops
- Docker & Kubernetes : Kops on AWS
- Docker & Kubernetes : Ingress controller on AWS with Kops
- Docker & Kubernetes : HashiCorp's Vault and Consul on minikube
- Docker & Kubernetes : HashiCorp's Vault and Consul - Auto-unseal using Transit Secrets Engine
- Docker & Kubernetes : Persistent Volumes & Persistent Volumes Claims - hostPath and annotations
- Docker & Kubernetes : Persistent Volumes - Dynamic volume provisioning
- Docker & Kubernetes : DaemonSet
- Docker & Kubernetes : Secrets
- Docker & Kubernetes : kubectl command
- Docker & Kubernetes : Assign a Kubernetes Pod to a particular node in a Kubernetes cluster
- Docker & Kubernetes : Configure a Pod to Use a ConfigMap
- AWS : EKS (Elastic Container Service for Kubernetes)
- Docker & Kubernetes : Run a React app in a minikube
- Docker & Kubernetes : Minikube install on AWS EC2
- Docker & Kubernetes : Cassandra with a StatefulSet
- Docker & Kubernetes : Terraform and AWS EKS
- Docker & Kubernetes : Pods and Service definitions
- Docker & Kubernetes : Service IP and the Service Type
- Docker & Kubernetes : Kubernetes DNS with Pods and Services
- Docker & Kubernetes : Headless service and discovering pods
- Docker & Kubernetes : Scaling and Updating application
- Docker & Kubernetes : Horizontal pod autoscaler on minikubes
- Docker & Kubernetes : From a monolithic app to micro services on GCP Kubernetes
- Docker & Kubernetes : Rolling updates
- Docker & Kubernetes : Deployments to GKE (Rolling update, Canary and Blue-green deployments)
- Docker & Kubernetes : Slack Chat Bot with NodeJS on GCP Kubernetes
- Docker & Kubernetes : Continuous Delivery with Jenkins Multibranch Pipeline for Dev, Canary, and Production Environments on GCP Kubernetes
- Docker & Kubernetes : NodePort vs LoadBalancer vs Ingress
- Docker & Kubernetes : MongoDB / MongoExpress on Minikube
- Docker & Kubernetes : Load Testing with Locust on GCP Kubernetes
- Docker & Kubernetes : MongoDB with StatefulSets on GCP Kubernetes Engine
- Docker & Kubernetes : Nginx Ingress Controller on Minikube
- Docker & Kubernetes : Setting up Ingress with NGINX Controller on Minikube (Mac)
- Docker & Kubernetes : Nginx Ingress Controller for Dashboard service on Minikube
- Docker & Kubernetes : Nginx Ingress Controller on GCP Kubernetes
- Docker & Kubernetes : Kubernetes Ingress with AWS ALB Ingress Controller in EKS
- Docker & Kubernetes : Setting up a private cluster on GCP Kubernetes
- Docker & Kubernetes : Kubernetes Namespaces (default, kube-public, kube-system) and switching namespaces (kubens)
- Docker & Kubernetes : StatefulSets on minikube
- Docker & Kubernetes : RBAC
- Docker & Kubernetes Service Account, RBAC, and IAM
- Docker & Kubernetes - Kubernetes Service Account, RBAC, IAM with EKS ALB, Part 1
- Docker & Kubernetes : Helm Chart
- Docker & Kubernetes : My first Helm deploy
- Docker & Kubernetes : Readiness and Liveness Probes
- Docker & Kubernetes : Helm chart repository with Github pages
- Docker & Kubernetes : Deploying WordPress and MariaDB with Ingress to Minikube using Helm Chart
- Docker & Kubernetes : Deploying WordPress and MariaDB to AWS using Helm 2 Chart
- Docker & Kubernetes : Deploying WordPress and MariaDB to AWS using Helm 3 Chart
- Docker & Kubernetes : Helm Chart for Node/Express and MySQL with Ingress
- Docker & Kubernetes : Deploy Prometheus and Grafana using Helm and Prometheus Operator - Monitoring Kubernetes node resources out of the box
- Docker & Kubernetes : Deploy Prometheus and Grafana using kube-prometheus-stack Helm Chart
- Docker & Kubernetes : Istio (service mesh) sidecar proxy on GCP Kubernetes
- Docker & Kubernetes : Istio on EKS
- Docker & Kubernetes : Istio on Minikube with AWS EC2 for Bookinfo Application
- Docker & Kubernetes : Deploying .NET Core app to Kubernetes Engine and configuring its traffic managed by Istio (Part I)
- Docker & Kubernetes : Deploying .NET Core app to Kubernetes Engine and configuring its traffic managed by Istio (Part II - Prometheus, Grafana, pin a service, split traffic, and inject faults)
- Docker & Kubernetes : Helm Package Manager with MySQL on GCP Kubernetes Engine
- Docker & Kubernetes : Deploying Memcached on Kubernetes Engine
- Docker & Kubernetes : EKS Control Plane (API server) Metrics with Prometheus
- Docker & Kubernetes : Spinnaker on EKS with Halyard
- Docker & Kubernetes : Continuous Delivery Pipelines with Spinnaker and Kubernetes Engine
- Docker & Kubernetes : Multi-node Local Kubernetes cluster : Kubeadm-dind (docker-in-docker)
- Docker & Kubernetes : Multi-node Local Kubernetes cluster : Kubeadm-kind (k8s-in-docker)
- Docker & Kubernetes : nodeSelector, nodeAffinity, taints/tolerations, pod affinity and anti-affinity - Assigning Pods to Nodes
- Docker & Kubernetes : Jenkins-X on EKS
- Docker & Kubernetes : ArgoCD App of Apps with Heml on Kubernetes
- Docker & Kubernetes : ArgoCD on Kubernetes cluster
- Docker & Kubernetes : GitOps with ArgoCD for Continuous Delivery to Kubernetes clusters (minikube) - guestbook
Ph.D. / Golden Gate Ave, San Francisco / Seoul National Univ / Carnegie Mellon / UC Berkeley / DevOps / Deep Learning / Visualization