ELK - Logstash, ElasticSearch, and Kibana
Elastic Search, Logstash, Kibana
Elastic Stack docker/kubernetes series:
This tutorial is the 3rd one for ELK tutorial series, and mostly about Kibana.
Kibana lets us visualize our Elasticsearch data and navigate the Elastic Stack. Kibana's histograms, line graphs, pie charts, sunbursts leverage the full aggregation capabilities of Elasticsearch.
One of the most common use cases for Elasticsearch is for logging, so common in fact that Elasticsearch provides an integrated logging platform called the ELK stack-Elasticsearch, Logstash, and Kibana-to make the process easy.
Logstash collects, parses, and enriches logs before indexing them into Elasticsearch. Elasticsearch acts as a centralized logging server, and Kibana is a graphic frontend that makes it easy to query and visualize what is happening across your network in near real-time. Time-Based Data

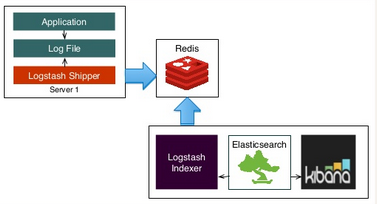
Picture credit : slideshare.net

Picture credit : Just Enough Kafka for the Elastic Stack, Part 1
For Elasticsearch and Logstash, please visit my previous two tutorials:
Kibana is used as a frontend client to search for and display messages from Elasticsearch cluster.
Kibana is an excellent tool to visualize our data. It has a very nice interface to build graphs, charts and much, much more based on data stored in an elasticsearch index.
This tutorial will show how we can use Kibana to query and visualize once events being shipped into Elasticsearch.
Our Logstash / Kibana setup has the following main components:
- Logstash: The server component of Logstash that processes incoming logs. In other words, Logstash collects, parses, and enriches logs before indexing them into Elasticsearch.
- Elasticsearch: Search engine based on Lucene and provides a distributed search engine with an HTTP web interface and schema-free JSON documents. We use Elasticsearch 2.4.4 for compatibility with Kabana 4.
curl -X <REST Verb> <Note>:<Port>/<Index>/<Type>/<ID>

curl -X GET http://localhost:9200/person/staff/789
An index is like a 'database' in a relational database. It has a mapping which defines multiple types. We can think of an index as a type of data organization mechanism, allowing the user to partition data a certain way. In terms of relational database we can see the analogy:
MySQL => Databases => Tables => Columns/Rows
Elasticsearch => Indices => Types => Documents with Properties
Other key concepts of Elasticsearch are replicas and shards, the mechanism Elasticsearch uses to distribute data around the cluster. Elasticsearch implements a clustered architecture that uses sharding to distribute data across multiple nodes, and replication to provide high availability.
The index is a logical namespace which maps to one or more primary shards and can have zero or more replica shards. A shard is a Lucene index and that an Elasticsearch index is a collection of shards. Our application talks to an index, and Elasticsearch routes our requests to the appropriate shards.
The smallest index we can have is one with a single shard. This setup may be small, but it may serve our current needs and is cheap to run. Suppose that our cluster consists of one node, and in our cluster we have one index, which has only one shard: an index with one primary shard and zero replica shards.
PUT /my_index { "settings": { "number_of_shards": 1, "number_of_replicas": 0 } } - Kibana: Web interface for searching and visualizing logs
- Logstash Forwarder: Installed on client servers that will send their logs to Logstash. Logstash Forwarder serves as a log forwarding agent that utilizes the lumberjack networking protocol to communicate with Logstash. Filebeat is a lightweight, open source shipper for log file data.
We're going to add the repositories for Elasticsearch and Logstash.
From the Elasticsearc - Repositories, download and install the Public Signing Key:
$ wget -qO - https://packages.elastic.co/GPG-KEY-elasticsearch | sudo apt-key add -
Add the repository definition to our /etc/apt/sources.list file:
$ echo "deb https://packages.elastic.co/elasticsearch/2.x/debian stable main" | sudo tee -a /etc/apt/sources.list.d/elasticsearch-2.x.list
Run apt-get update and the repository is ready for use. We can install it with:
$ sudo apt-get update && sudo apt-get install elasticsearch
Configure Elasticsearch to automatically start at boot. For a distribution using SysV init, then we will need to run:
# System V
$ sudo update-rc.d elasticsearch defaults 95 10

# Upstart (Ubuntu 14)
$ sudo /etc/init.d/elasticsearch start

# systemd (Ubuntu 16)
$ sudo systemctl daemon-reload
$ sudo systemctl enable elasticsearch
To start:
# System V
$ sudo /etc/init.d/elasticsearch start

# Upstart (Ubuntu 14)
$ sudo service elasticsearch start

# systemd (Ubuntu 16)
$ sudo systemctl start elasticsearch
Next, we may need to tell APT not to upgrade Logstash or Elasticsearch because there could be breaking changes between versions (for example, Kibana 5 won't work with Elasticsearch 2.x):
$ sudo apt-get install aptitude
$ sudo aptitude hold elasticsearch logstash
Current versions:
$ /usr/share/elasticsearch/bin/elasticsearch --version
Version: 2.4.4, Build: fcbb46d/2017-01-03T11:33:16Z, JVM: 1.8.0_111

$ /opt/logstash/bin/logstash --version
logstash 2.4.1
Now, a quick test to make sure that Elasticsearch was installed correctly and works. To do that, start Elasticsearch with:
$ sudo service elasticsearch start
 * Starting Elasticsearch Server
and run:
$ curl http://localhost:9200
Curl should output something like this:
{
  "name" : "MyNode-1",
  "cluster_name" : "MyCluster",
  "cluster_uuid" : "wqY_NT9FTICHEKSYgxg0lw",
  "version" : {
    "number" : "2.4.4",
    "build_hash" : "fcbb46dfd45562a9cf00c604b30849a6dec6b017",
    "build_timestamp" : "2017-01-03T11:33:16Z",
    "build_snapshot" : false,
    "lucene_version" : "5.5.2"
  },
  "tagline" : "You Know, for Search"
}
Download and install the Public Signing Key:
$ wget -qO - https://packages.elastic.co/GPG-KEY-elasticsearch | sudo apt-key add -
Add the repository definition to our /etc/apt/sources.list.d/kibana.list file:
$ echo "deb http://packages.elastic.co/kibana/4.6/debian stable main" | sudo tee -a /etc/apt/sources.list
Run apt-get update and the repository is ready for use. Install Kibana with the following command:
$ sudo apt-get update && sudo apt-get install kibana
Configure Kibana to automatically start during bootup. For the System V version of init, run the following command:
# SystemV
$ sudo update-rc.d kibana defaults 95 10

# systemd
$ sudo /bin/systemctl daemon-reload
$ sudo /bin/systemctl enable kibana.service
Start it:
$ sudo service kibana start
Kibana is now running on port 5601.
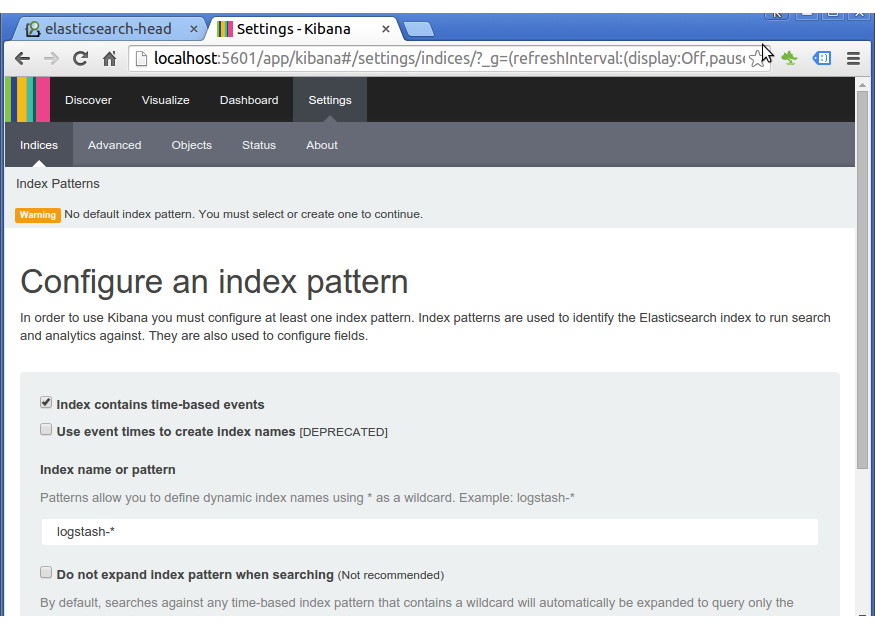
By default, Kibana connects to the Elasticsearch instance running on localhost. To connect to a different Elasticsearch instance, modify the Elasticsearch URL in the /opt/kibana/config/kibana.yml configuration file and restart Kibana.
We are prompted to define an index pattern that matches the name of one or more of our indices. This is because we need to tell Kibana which Elasticsearch indices we want to explore.
As we can see from the initial Kibana screen, by default, Kibana guesses that we're working with data being fed into Elasticsearch by Logstash.
If that's the case, we can use the default logstash-* as the index pattern. The asterisk (*) matches zero or more characters in an index's name.
Let's start Logstash if it's not running, and then refresh Kibana.
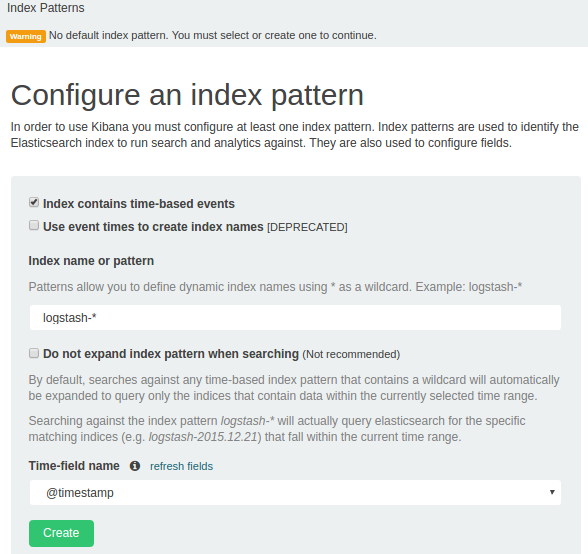
Click "Create" button to add the index pattern. This first pattern is automatically configured as the default.
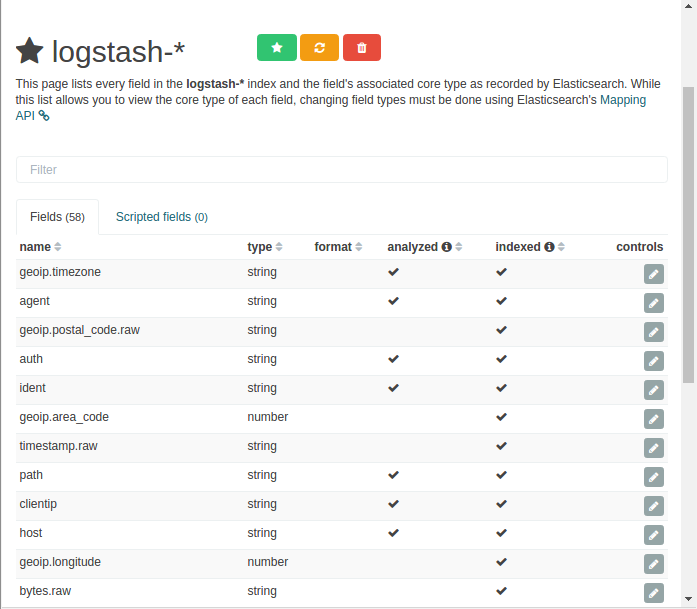
Note that we fed the logstash data into Elasticsearch, as we've done in ELK - Logstash with ElasticSearch - Sample : Apache logs.
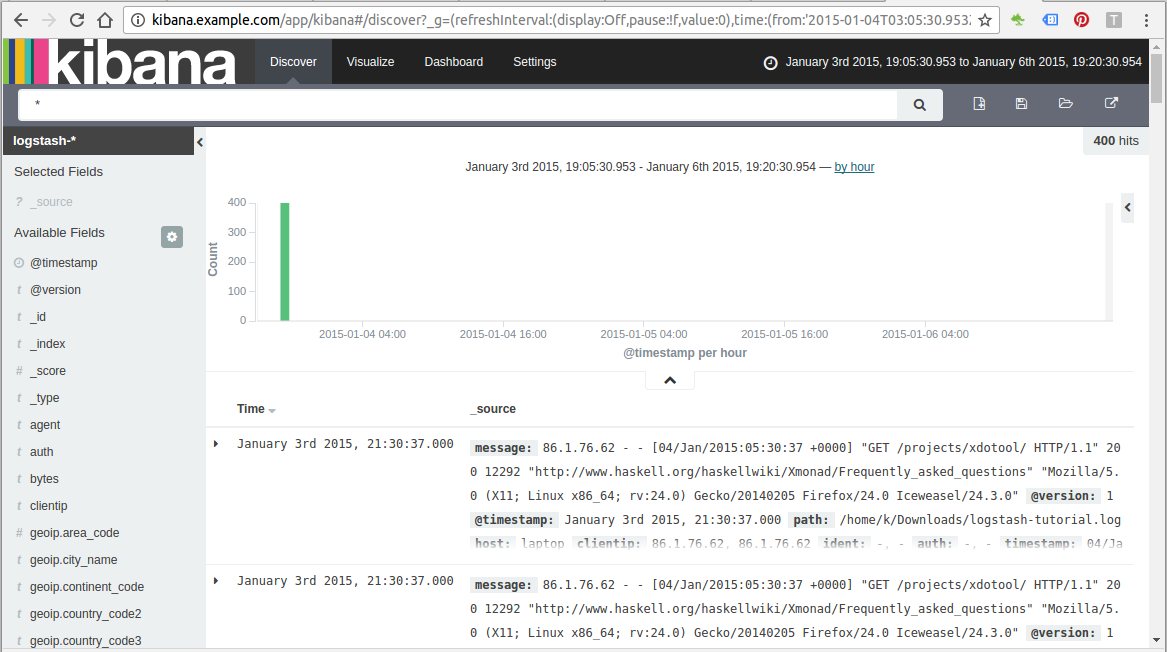
We can search and browse our data interactively from the "Discover" page:
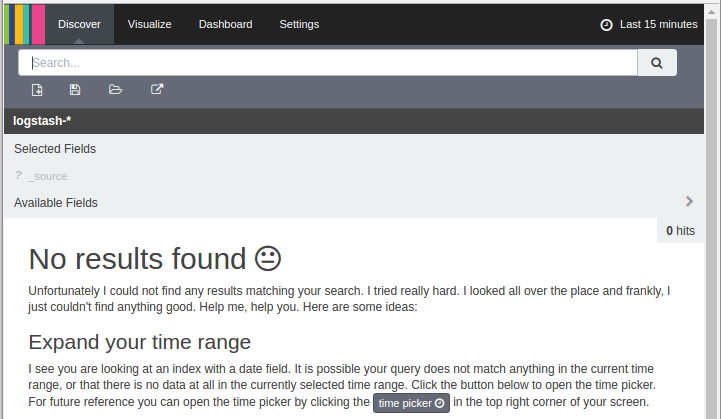
We don't see anything because we're using old logs while the default setting for timestamp is set to "Last 15 minutes" in the top right corner of the screen. After reset this, we have the following page showing 400 hits:
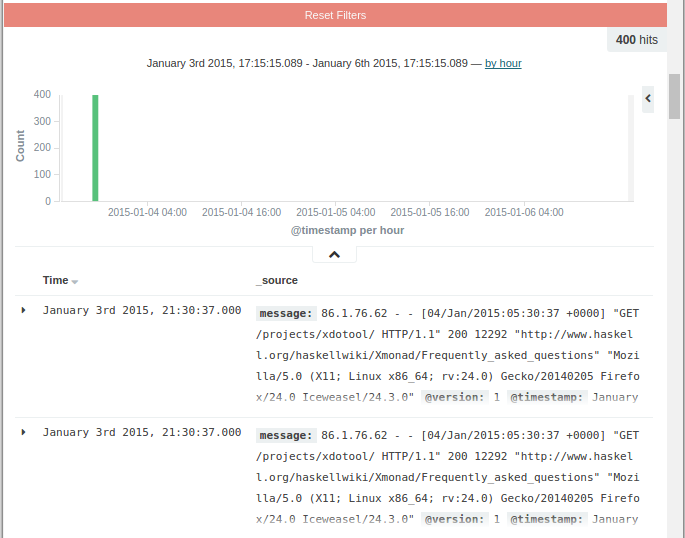
Note that the log was recorded for a just one day, 2015.01.03, so we needed to adjust the timestamp accordingly.
elasticsearch-head is a web front end for browsing and interacting with an Elastic Search cluster.
To install it, we can run:
$ $ sudo /usr/share/elasticsearch/bin/plugin install mobz/elasticsearch-head
[sudo] password for k:
-> Installing mobz/elasticsearch-head...
...
Installed head into /usr/share/elasticsearch/plugins/head
Then, elasticsearch-head will be accessible at http://localhost:9200/_plugin/head/

We configured Kibana to listen on localhost, so we must set up a reverse proxy to allow external access to it. In this tutorial, we'll access Kibana with kibana.example.com (actually, this is still local), and Nginx will do port forwarding to local 5601.
Here is the Nginx config (kibana.example.com.conf):
server {
    listen 80;

    server_name kibana.example.com;

    auth_basic "Restricted Access";
    auth_basic_user_file /etc/nginx/htpasswd.users;

    location / {
        proxy_pass http://localhost:5601;
        proxy_http_version 1.1;
        proxy_set_header Upgrade $http_upgrade;
        proxy_set_header Connection 'upgrade';
        proxy_set_header Host $host;
        proxy_cache_bypass $http_upgrade;
    }
}
This configures Nginx to direct our server's HTTP traffic to the Kibana application, which is listening on localhost:5601.
Setup soft link:
$ sudo ln -s /etc/nginx/sites-available/kibana.example.com.conf /etc/nginx/sites-enabled/
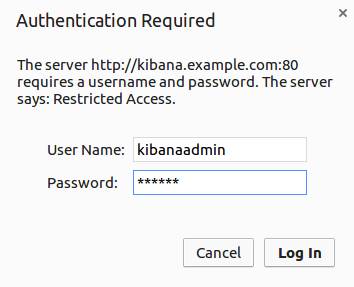
Also, we need to setup an admin user, called "kibanaadmin".
We may want to use htpasswd to create the admin user that can access the Kibana web interface:
$ sudo htpasswd -c /etc/nginx/htpasswd.users kibanaadmin
Nginx will use the htpasswd.users file and require basic authentication
Now restart the Nginx:
$ sudo service nginx restart
So, when we try to access Kibana, it will ask us auth:
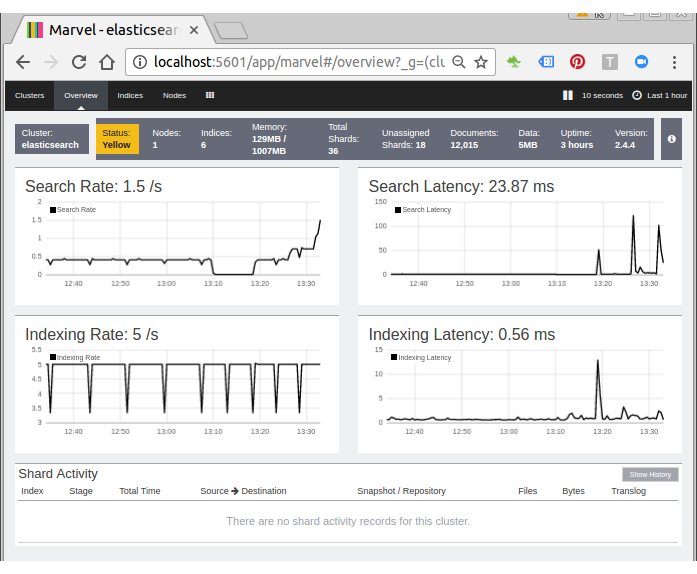
Marvel enables us to easily monitor Elasticsearch through Kibana. We can view our cluster's health and performance in real time as well as analyze past cluster, index, and node metrics.
To use Marvel, we need to install two components: An Elasticsearch plugin that collects data from each node in our cluster. This plugin must be installed on every node. A Kibana app that provides the Marvel monitoring UI:
- Marvel agent : we install the agent on on each node in our cluster. The Marvel agent collects and indexes metrics from Elasticsearch and we visualize the data through the Marvel dashboards in Kibana. The agent can index data on the same cluster, or send it to an external monitoring cluster.
- Marvel application : when we open the Marvel app in Kibana, we see a list of the clusters that we are monitoring.
Ref : Marvel - Getting Started
Install the Marvel agent plugin on each node. Install license and marvel-agent:
$ sudo /usr/share/elasticsearch/bin/plugin install license
-> Installing license...
Trying https://download.elastic.co/elasticsearch/release/org/elasticsearch/plugin/license/2.4.4/license-2.4.4.zip ...
Downloading .......DONE
Verifying https://download.elastic.co/elasticsearch/release/org/elasticsearch/plugin/license/2.4.4/license-2.4.4.zip checksums if available ...
Downloading .DONE
Installed license into /usr/share/elasticsearch/plugins/license


$ sudo /usr/share/elasticsearch/bin/plugin install marvel-agent
-> Installing marvel-agent...
Trying https://download.elastic.co/elasticsearch/release/org/elasticsearch/plugin/marvel-agent/2.4.4/marvel-agent-2.4.4.zip ...
Downloading ..........DONE
Verifying https://download.elastic.co/elasticsearch/release/org/elasticsearch/plugin/marvel-agent/2.4.4/marvel-agent-2.4.4.zip checksums if available ...
Downloading .DONE
@@@@@@@@@@@@@@@@@@@@@@@@@@@@@@@@@@@@@@@@@@@@@@@@@@@@@@@@@@@
@     WARNING: plugin requires additional permissions     @
@@@@@@@@@@@@@@@@@@@@@@@@@@@@@@@@@@@@@@@@@@@@@@@@@@@@@@@@@@@
* java.lang.RuntimePermission setFactory
* javax.net.ssl.SSLPermission setHostnameVerifier
See http://docs.oracle.com/javase/8/docs/technotes/guides/security/permissions.html
for descriptions of what these permissions allow and the associated risks.

Continue with installation? [y/N]y
Installed marvel-agent into /usr/share/elasticsearch/plugins/marvel-agent
Install the Marvel app into Kibana:
$ sudo /opt/kibana/bin/kibana plugin --install elasticsearch/marvel/latest
[sudo] password for k:
Installing marvel
Attempting to transfer from https://download.elastic.co/elasticsearch/marvel/marvel-latest.tar.gz
Transferring 10162116 bytes....................
Transfer complete
Extracting plugin archive
Extraction complete
Optimizing and caching browser bundles...
Plugin installation complete
Restart kibana:
$ sudo systemctl restart kibana
Or just run it:
root@laptop:/opt/kibana# bin/kibana
  log   [13:16:06.131] [info][optimize] Optimizing and caching bundles for marvel, kibana and statusPage. This may take a few minutes
  log   [13:18:43.952] [info][optimize] Optimization of bundles for marvel, kibana and statusPage complete in 157.78 seconds
  log   [13:18:44.129] [info][status][plugin:kibana@1.0.0] Status changed from uninitialized to green - Ready
  log   [13:18:44.471] [info][status][plugin:elasticsearch@1.0.0] Status changed from uninitialized to yellow - Waiting for Elasticsearch
  log   [13:18:44.568] [info][status][plugin:marvel@2.4.4] Status changed from uninitialized to yellow - Waiting for Elasticsearch
  log   [13:18:44.627] [info][status][plugin:kbn_vislib_vis_types@1.0.0] Status changed from uninitialized to green - Ready
  log   [13:18:44.645] [info][status][plugin:markdown_vis@1.0.0] Status changed from uninitialized to green - Ready
  log   [13:18:44.707] [info][status][plugin:metric_vis@1.0.0] Status changed from uninitialized to green - Ready
  log   [13:18:44.723] [info][status][plugin:spyModes@1.0.0] Status changed from uninitialized to green - Ready
  log   [13:18:44.850] [info][status][plugin:statusPage@1.0.0] Status changed from uninitialized to green - Ready
  log   [13:18:44.870] [info][status][plugin:table_vis@1.0.0] Status changed from uninitialized to green - Ready
  log   [13:18:51.283] [info][listening] Server running at http://0.0.0.0:5601
  log   [13:18:51.454] [info][status][plugin:marvel@2.4.4] Status changed from yellow to green - Marvel ready
  log   [13:18:51.474] [info][status][plugin:elasticsearch@1.0.0] Status changed from yellow to green - Kibana index ready
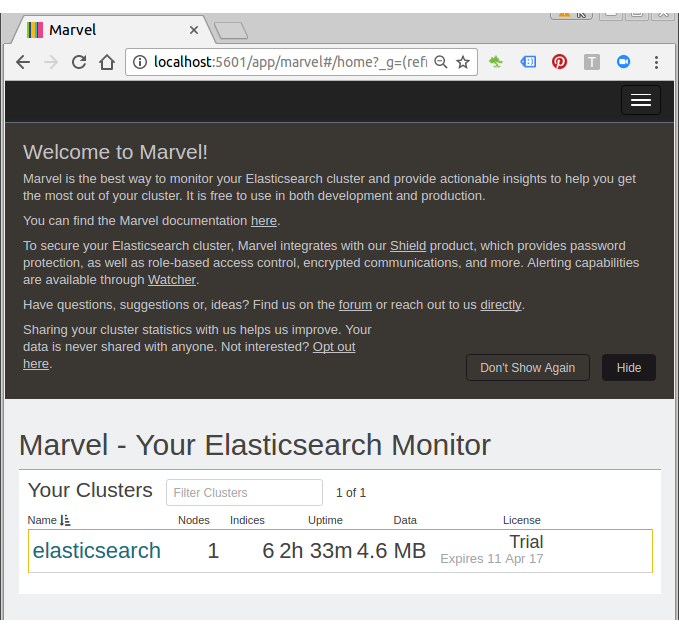
To verify our Marvel installation, point our web browser at http://localhost:5601/ to open Kibana, click the App Switcher icon in the Kibana menu bar, and select Marvel:
Marvel displays a list of the clusters we are monitoring:
Elastic Search, Logstash, Kibana
Elastic Stack docker/kubernetes series:
Ph.D. / Golden Gate Ave, San Francisco / Seoul National Univ / Carnegie Mellon / UC Berkeley / DevOps / Deep Learning / Visualization