Docker & Kubernetes - EKS Control Plane (API server) Metrics with Prometheus
This post will show how to get Kubernetes API Server metrics from a Kubernetes (EKS) cluster and visualized them using Prometheus.
Kubernetes core components provide a rich set of metrics we can use to observe what is happening in the Control Plane.
We can see how many watchers are on each resource in the API Server, the number of audit trail events, the latency of the requests to the API Server, and etc. These metrics come from the Kubernetes API Server, Kubelet, Cloud Controller Manager, and the Scheduler. These components expose "metrics" endpoints (which respond via HTTP) at /metrics with a text/plain content type.
We need following tools: kubectl, eksctl, helm.
Before moving on a EKS cluster, we can check the metrics from our local single node cluster.
$ minikube start 😄 minikube v1.0.0 on darwin (amd64) 👍 minikube will upgrade the local cluster from Kubernetes 1.13.4 to 1.14.0 🤹 Downloading Kubernetes v1.14.0 images in the background ... 💡 Tip: Use 'minikube start -p' to create a new cluster, or 'minikube delete' to delete this one. 🔄 Restarting existing virtualbox VM for "minikube" ... ⌛ Waiting for SSH access ... 📶 "minikube" IP address is 192.168.99.100 🐳 Configuring Docker as the container runtime ... 🐳 Version of container runtime is 17.12.1-ce ⌛ Waiting for image downloads to complete ... ✨ Preparing Kubernetes environment ... 💾 Downloading kubelet v1.14.0 💾 Downloading kubeadm v1.14.0 🚜 Pulling images required by Kubernetes v1.14.0 ... 🔄 Relaunching Kubernetes v1.14.0 using kubeadm ... ⌛ Waiting for pods: apiserver proxy etcd scheduler controller dns 📯 Updating kube-proxy configuration ... 🤔 Verifying component health ..... 💗 kubectl is now configured to use "minikube" 🏄 Done! Thank you for using minikube! $ kubectl get --raw /metrics ... # TYPE APIServiceRegistrationController_work_duration summary APIServiceRegistrationController_work_duration{quantile="0.5"} 459 APIServiceRegistrationController_work_duration{quantile="0.9"} 2570 APIServiceRegistrationController_work_duration{quantile="0.99"} 4212 APIServiceRegistrationController_work_duration_sum 53723 APIServiceRegistrationController_work_duration_count 30 ... # TYPE apiserver_admission_controller_admission_duration_seconds histogram apiserver_admission_controller_admission_duration_seconds_bucket {name="DefaultStorageClass",operation="CREATE",rejected="false",type="admit",le="25000"} 144 ... workqueue_work_duration_seconds_bucket{name="crd_naming_condition_controller",le="10"} 0 workqueue_work_duration_seconds_bucket{name="crd_naming_condition_controller",le="+Inf"} 0 workqueue_work_duration_seconds_sum{name="crd_naming_condition_controller"} 0 workqueue_work_duration_seconds_count{name="crd_naming_condition_controller"} 0
These metrics are output in a Prometheus format. It can scan and scrape metrics endpoints within our cluster, and will even scan its own endpoint.
The syntax for a Prometheus metric is:
metric_name {[ "tag" = "value" ]*} value
This allows us to set a metric_name, define tags on the metric which can be used for querying, and set a value.
An example of this for the apiserver_request_count would be:
apiserver_request_count{client="kube-apiserver/v1.11.8 (linux/amd64) kubernetes/7c34c0d",code="200",contentType="application/vnd.kubernetes.protobuf",
resource="pods",scope="cluster",subresource="",verb="LIST"} 7
This tells us that there have been 7 requests to the pods resource to LIST.
W can create the cluster using the eksctl create cluster command (it usually takes 10+ minutes):
$ eksctl create cluster --name=control-plane-metrics \
--region=us-east-1 --zones=us-east-1a,us-east-1b,us-east-1c,us-east-1d,us-east-1f \
--node-type=m5.large --nodes-min=2 --nodes-max=2
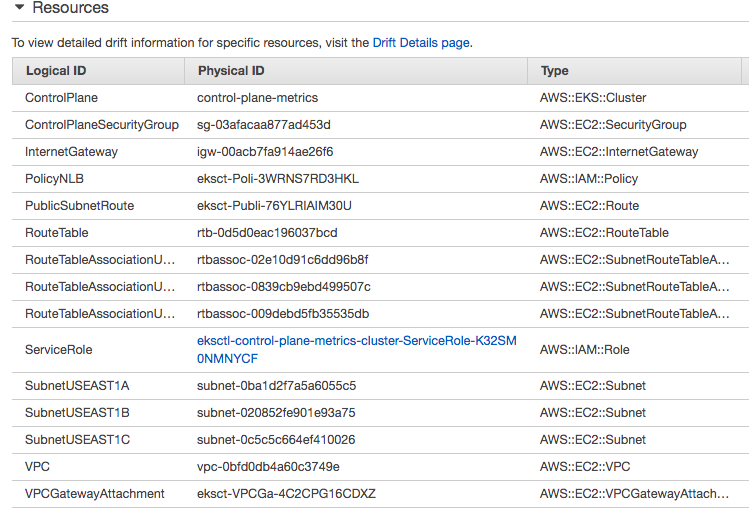
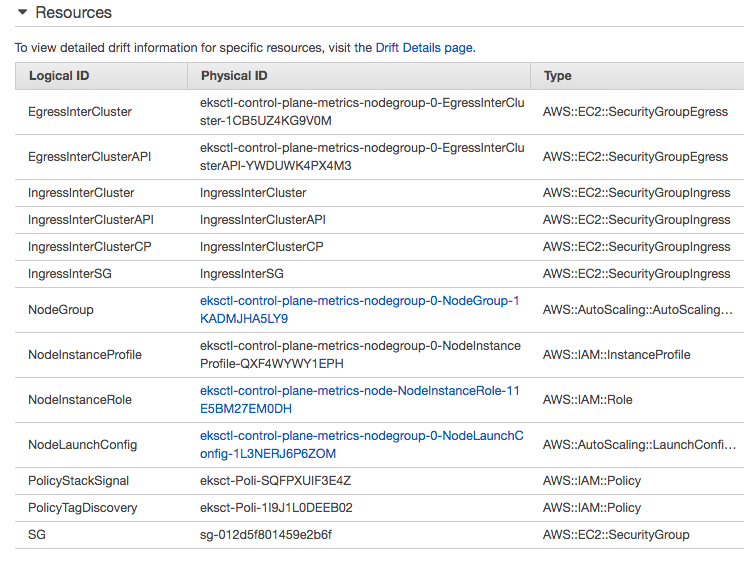
This will create two stacks of Cloudformation:

- EKS cluster:
- Node Group:
If kubectl get svc command succeeds for the EKS cluster, we're good to go:
$ kubectl get svc
NAME         TYPE        CLUSTER-IP   EXTERNAL-IP   PORT(S)   AGE
kubernetes   ClusterIP   10.100.0.1   <none>        443/TCP   13m

$ kubectl config current-context
k8s@control-plane-metrics.us-east-1.eksctl.io

$ kubectl get nodes
NAME                              STATUS    ROLES     AGE       VERSION
ip-192-168-100-199.ec2.internal   Ready     <none>    12m       v1.10.3
ip-192-168-132-116.ec2.internal   Ready     <none>    12m       v1.10.3
On EKS cluster, we can see similar metrics:
$ kubectl get --raw /metrics
Because we'll set up Prometheus using helm, we need to set it up.
We can set up a helm locally so that we don't need to have tiller running within our cluster (Using Helm with Amazon EKS) so that we can install and manage charts using the helm CLI on our local system.
On macOS with Homebrew, install the binaries with the following command:
$ brew install kubernetes-helm
Then, let's handle tiller. On another terminal, do the following:
$ kubectl create namespace tiller
namespace/tiller created

$ export TILLER_NAMESPACE=tiller

$ tiller -listen=localhost:44134 -storage=secret -logtostderr
[main] 2019/04/11 11:01:19 Starting Tiller v2.12.1 (tls=false)
[main] 2019/04/11 11:01:19 GRPC listening on localhost:44134
[main] 2019/04/11 11:01:19 Probes listening on :44135
[main] 2019/04/11 11:01:19 Storage driver is Secret
[main] 2019/04/11 11:01:19 Max history per release is 0
[tiller] 2019/04/11 11:01:57 preparing install for prometheus
[storage] 2019/04/11 11:01:57 getting release history for "prometheus"
[tiller] 2019/04/11 11:01:58 rendering prometheus chart using values
First, we need create a Kubernetes namespace. Then, using helm, we can deploy the stable/prometheus package:
$ kubectl create namespace prometheus namespace/prometheus created $ helm install stable/prometheus --name prometheus \ --namespace prometheus --set alertmanager.persistentVolume.storageClass="gp2",server.persistentVolume.storageClass="gp2",server.service.type=LoadBalancer NAME: prometheus LAST DEPLOYED: Thu Apr 11 11:01:58 2019 NAMESPACE: prometheus STATUS: DEPLOYED RESOURCES: ==> v1/ServiceAccount NAME SECRETS AGE prometheus-alertmanager 1 4s prometheus-kube-state-metrics 1 4s prometheus-node-exporter 1 4s prometheus-pushgateway 1 4s prometheus-server 1 4s ==> v1beta1/ClusterRole NAME AGE prometheus-kube-state-metrics 4s prometheus-server 4s ==> v1beta1/Deployment NAME DESIRED CURRENT UP-TO-DATE AVAILABLE AGE prometheus-alertmanager 1 1 1 0 3s prometheus-kube-state-metrics 1 1 1 0 3s prometheus-pushgateway 1 1 1 0 3s prometheus-server 1 1 1 0 3s ==> v1/PersistentVolumeClaim NAME STATUS VOLUME CAPACITY ACCESS MODES STORAGECLASS AGE prometheus-alertmanager Bound pvc-e72eee04-5c83-11e9-a267-12b8272e7f36 2Gi RWO gp2 4s prometheus-server Bound pvc-e73bd8e9-5c83-11e9-a267-12b8272e7f36 8Gi RWO gp2 4s ==> v1beta1/ClusterRoleBinding NAME AGE prometheus-kube-state-metrics 4s prometheus-server 4s ==> v1/Service NAME TYPE CLUSTER-IP EXTERNAL-IP PORT(S) AGE prometheus-alertmanager ClusterIP 10.100.178.6780/TCP 3s prometheus-kube-state-metrics ClusterIP None 80/TCP 3s prometheus-node-exporter ClusterIP None 9100/TCP 3s prometheus-pushgateway ClusterIP 10.100.45.118 9091/TCP 3s prometheus-server LoadBalancer 10.100.232.105 80:31672/TCP 3s ==> v1beta1/DaemonSet NAME DESIRED CURRENT READY UP-TO-DATE AVAILABLE NODE SELECTOR AGE prometheus-node-exporter 2 2 2 2 2 3s ==> v1/Pod(related) NAME READY STATUS RESTARTS AGE prometheus-node-exporter-d9t7s 1/1 Running 0 3s prometheus-node-exporter-qnvgd 1/1 Running 0 3s prometheus-alertmanager-cfd88b967-jp7cm 0/2 ContainerCreating 0 3s prometheus-kube-state-metrics-66c4f4bf75-hzfvw 0/1 ContainerCreating 0 3s prometheus-pushgateway-64bfdf645d-prbb2 0/1 ContainerCreating 0 3s prometheus-server-67b5f59b9d-5s42n 0/2 Init:0/1 0 3s ==> v1/ConfigMap NAME DATA AGE prometheus-alertmanager 1 5s prometheus-server 3 5s
Once that is installed, we can get the Load Balancer's address by listing services:
$ kubectl get svc -o wide -n prometheus
NAME                            TYPE           CLUSTER-IP       EXTERNAL-IP                                                               PORT(S)        AGE       SELECTOR
prometheus-alertmanager         ClusterIP      10.100.178.67    <none>                                                                    80/TCP         5m        app=prometheus,component=alertmanager,release=prometheus
prometheus-kube-state-metrics   ClusterIP      None             <none>                                                                    80/TCP         5m        app=prometheus,component=kube-state-metrics,release=prometheus
prometheus-node-exporter        ClusterIP      None             <none>                                                                    9100/TCP       5m        app=prometheus,component=node-exporter,release=prometheus
prometheus-pushgateway          ClusterIP      10.100.45.118    <none>                                                                    9091/TCP       5m        app=prometheus,component=pushgateway,release=prometheus
prometheus-server               LoadBalancer   10.100.232.105   ae7f7adb75c8311e9a26712b8272e7f3-1478851232.us-east-1.elb.amazonaws.com   80:31672/TCP   5m        app=prometheus,component=server,release=prometheus
With this Load Balancer address, we can navigate to it in our browser, which will load the Prometheus UI.
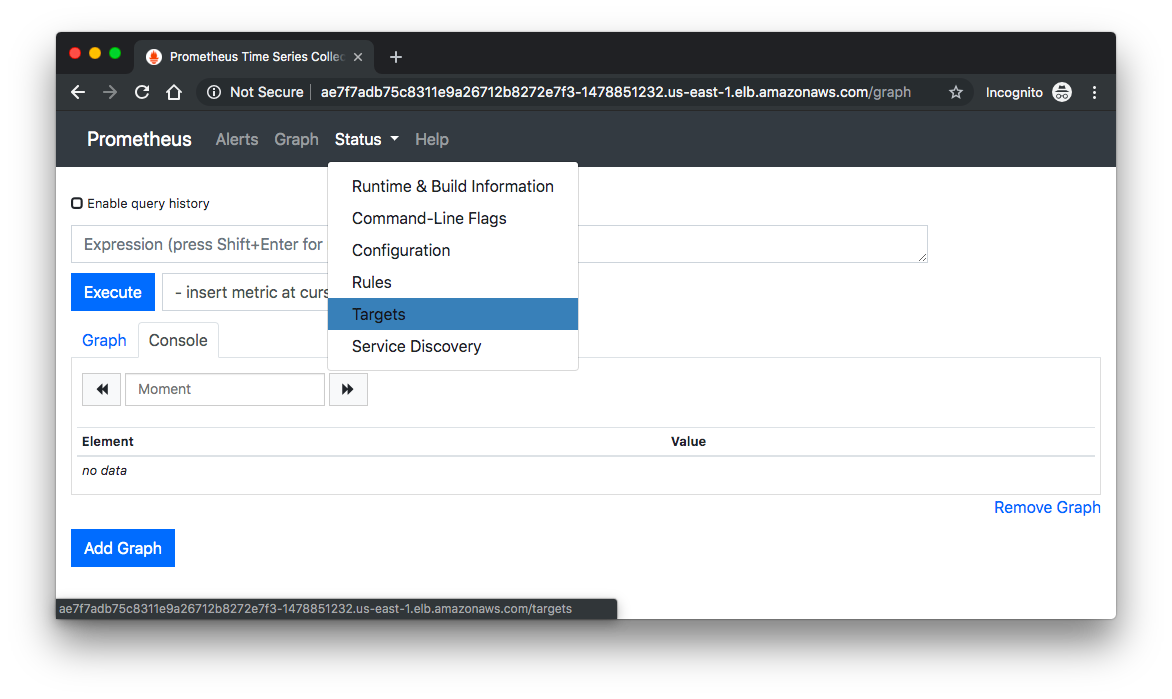
From here we can go to "Status" => "Targets", then we can see the Control Plane nodes:
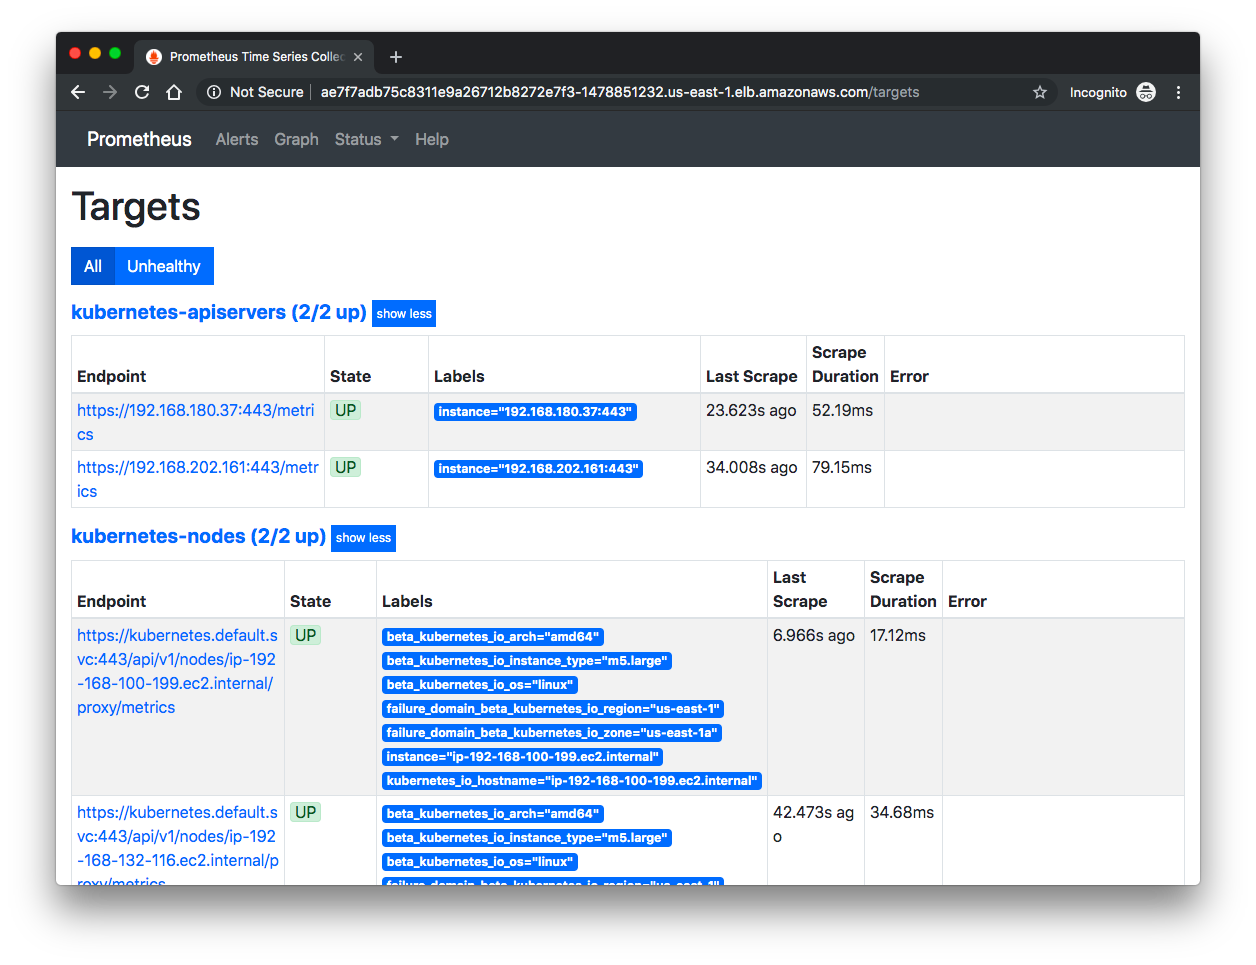
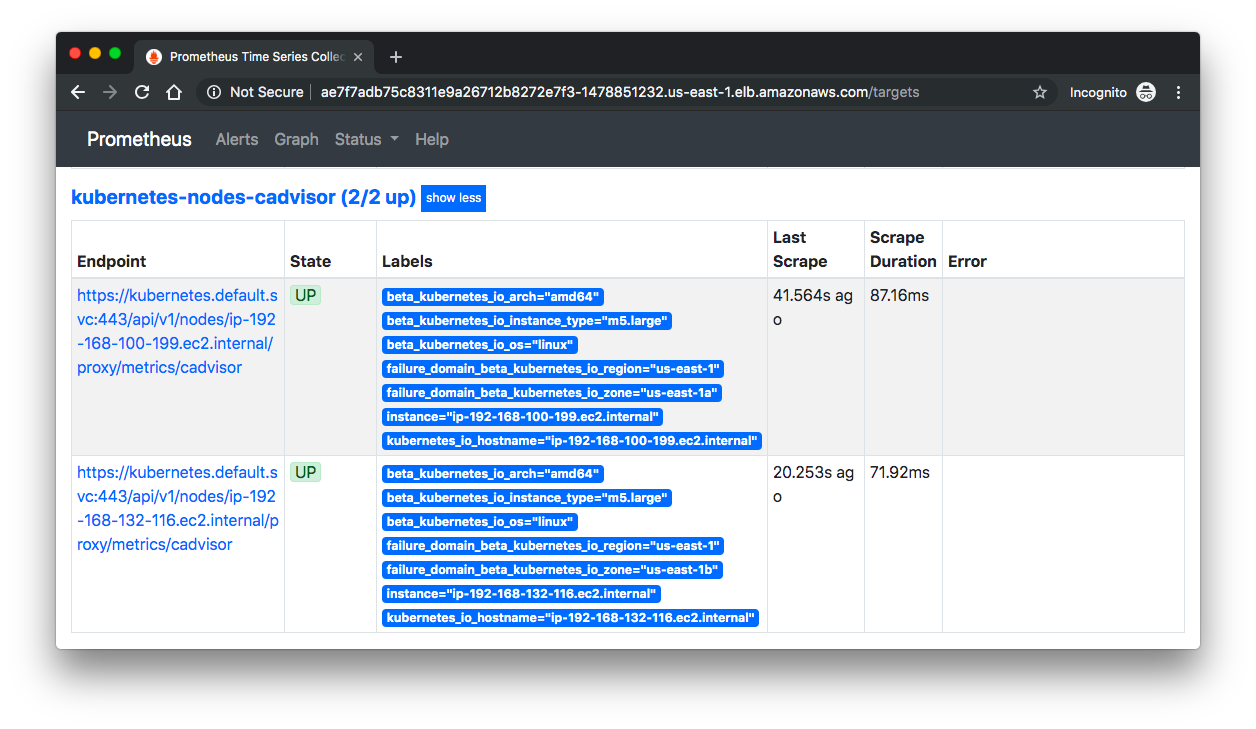
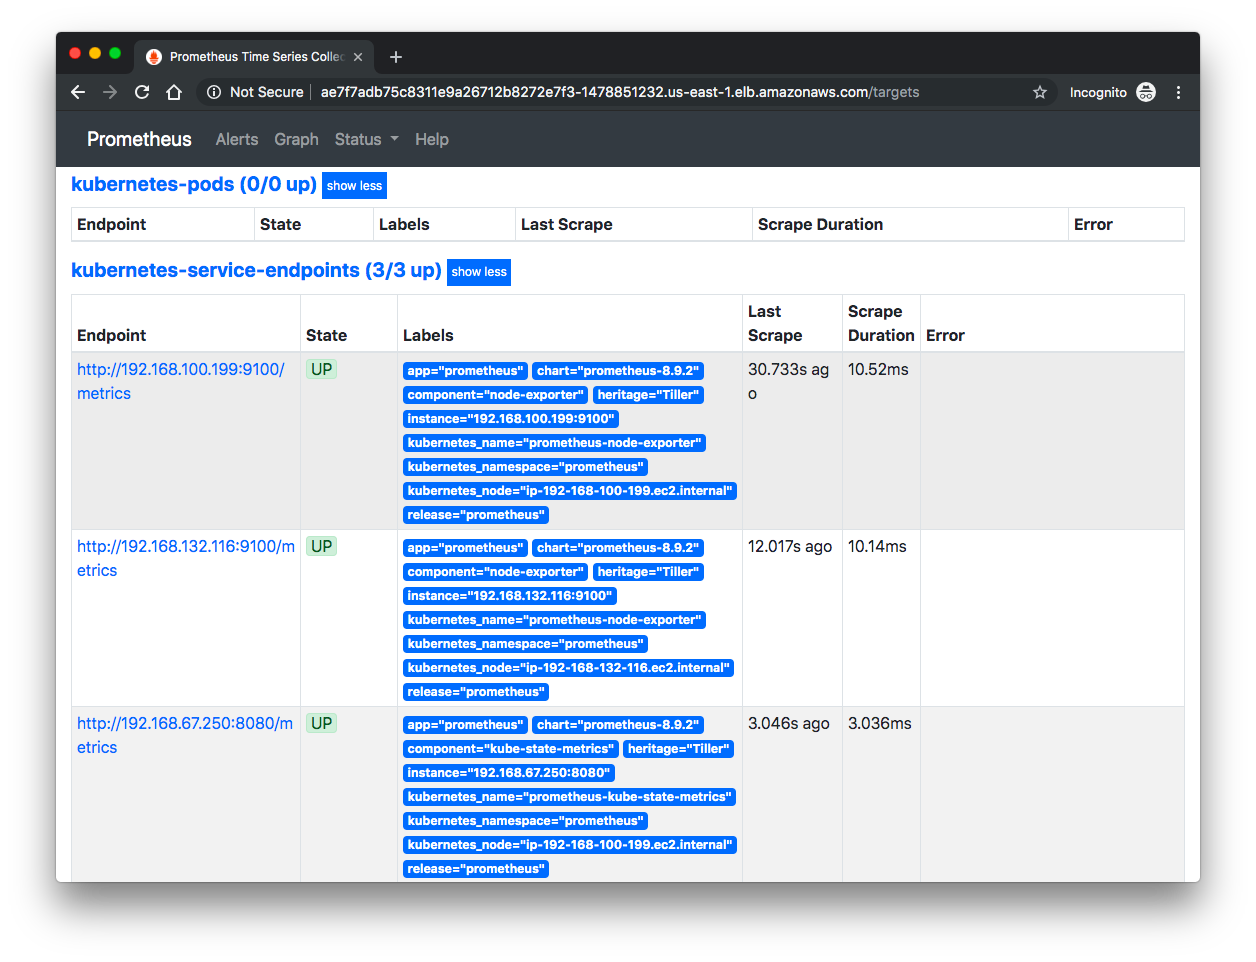
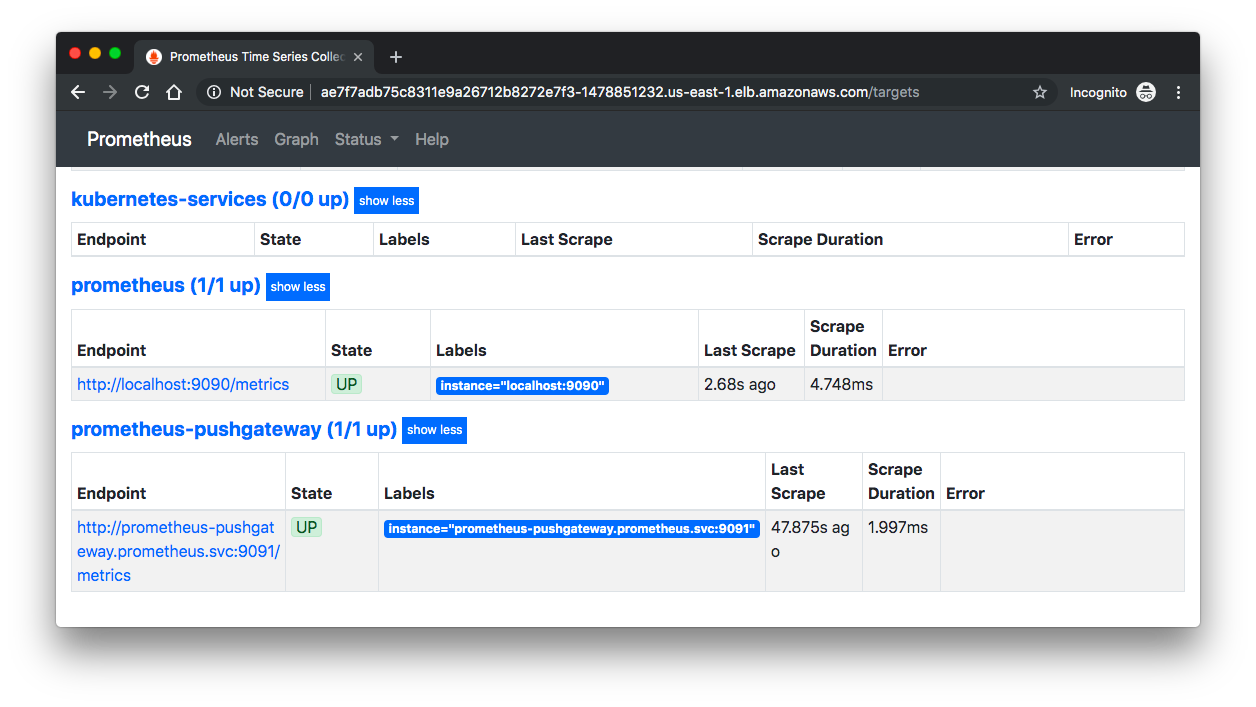
If we can see our nodes, we can go inspect some of the metrics.
Navigate to "Graph" and in the drop-down – insert metric at cursor – select any metric starting with "apiserver_" and click "Execute". This will load the last-synced data from the API Server.
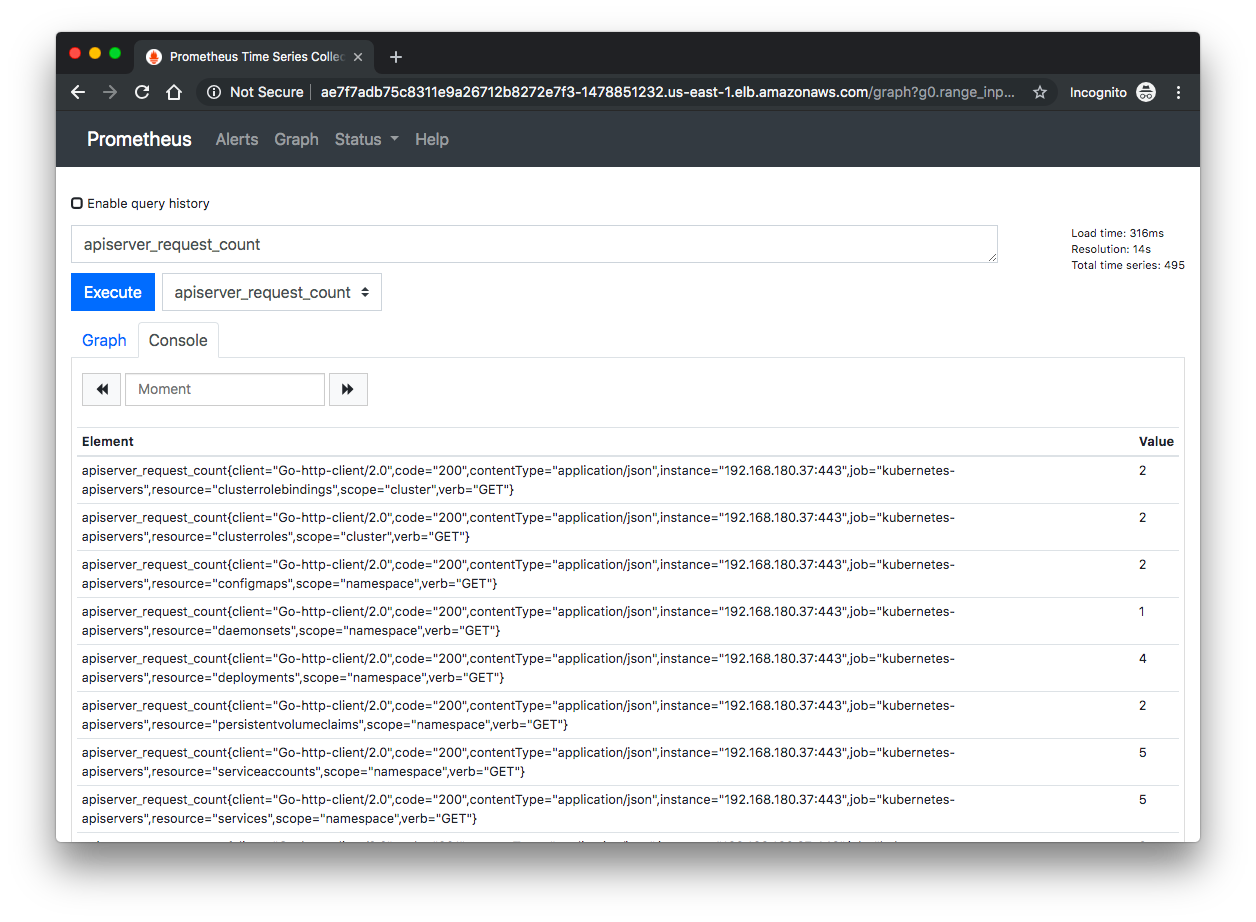
Now that we can see our metrics in the Console view, we can switch over to the "Graph" and visualize this data:
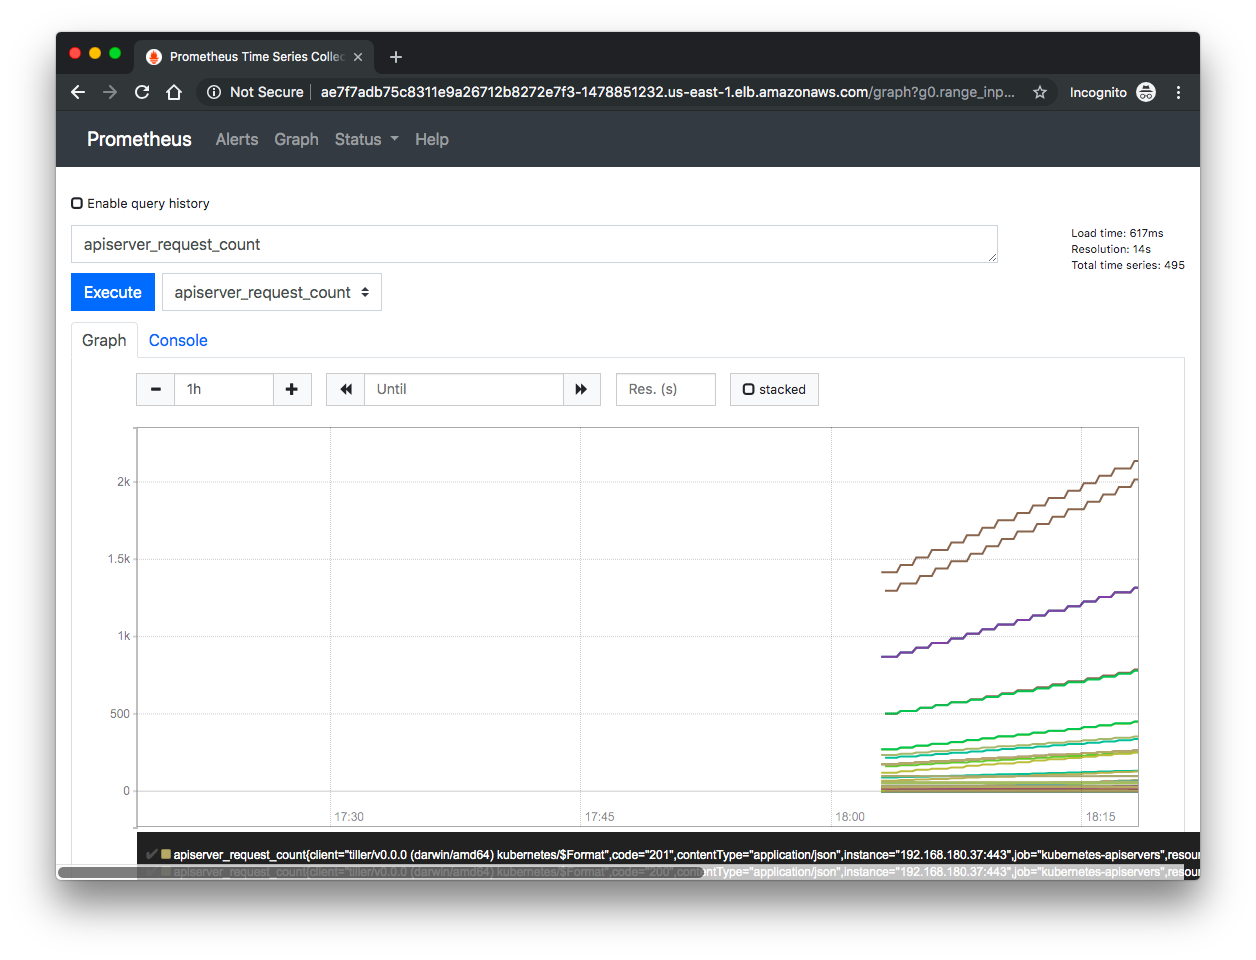
Note that we can also use Prometheus to set alerting rules which will populate the Alerts tab.
Since we deployed a cluster specifically to run this test and we may want to tear it down: 1. prometheus namespace 2. the cluster:
$ kubectl delete namespace prometheus
namespace "prometheus" deleted

$ eksctl delete cluster --name=control-plane-metrics --region=us-east-1
2019-04-11T11:21:40-07:00 [ℹ]  deleting EKS cluster "control-plane-metrics"
2019-04-11T11:21:40-07:00 [ℹ]  will delete stack "eksctl-control-plane-metrics-nodegroup-0"
2019-04-11T11:21:40-07:00 [ℹ]  waiting for stack "eksctl-control-plane-metrics-nodegroup-0" to get deleted
2019-04-11T11:24:40-07:00 [ℹ]  will delete stack "eksctl-control-plane-metrics-cluster"
2019-04-11T11:24:41-07:00 [✔]  kubeconfig has been updated
2019-04-11T11:24:41-07:00 [✔]  the following EKS cluster resource(s) for "control-plane-metrics" will be deleted: node group, cluster. If in doubt, check CloudFormation console

$ kubectl config current-context
k8s@control-plane-metrics.us-east-1.eksctl.io

$ kubectl config use-context minikube
Switched to context "minikube".

$ kubens
default
kube-public
kube-system

$ kubectl get svc
NAME         TYPE        CLUSTER-IP   EXTERNAL-IP   PORT(S)   AGE
kubernetes   ClusterIP   10.96.0.1    <none>        443/TCP   137m
References:
Docker & K8s
- Docker install on Amazon Linux AMI
- Docker install on EC2 Ubuntu 14.04
- Docker container vs Virtual Machine
- Docker install on Ubuntu 14.04
- Docker Hello World Application
- Nginx image - share/copy files, Dockerfile
- Working with Docker images : brief introduction
- Docker image and container via docker commands (search, pull, run, ps, restart, attach, and rm)
- More on docker run command (docker run -it, docker run --rm, etc.)
- Docker Networks - Bridge Driver Network
- Docker Persistent Storage
- File sharing between host and container (docker run -d -p -v)
- Linking containers and volume for datastore
- Dockerfile - Build Docker images automatically I - FROM, MAINTAINER, and build context
- Dockerfile - Build Docker images automatically II - revisiting FROM, MAINTAINER, build context, and caching
- Dockerfile - Build Docker images automatically III - RUN
- Dockerfile - Build Docker images automatically IV - CMD
- Dockerfile - Build Docker images automatically V - WORKDIR, ENV, ADD, and ENTRYPOINT
- Docker - Apache Tomcat
- Docker - NodeJS
- Docker - NodeJS with hostname
- Docker Compose - NodeJS with MongoDB
- Docker - Prometheus and Grafana with Docker-compose
- Docker - StatsD/Graphite/Grafana
- Docker - Deploying a Java EE JBoss/WildFly Application on AWS Elastic Beanstalk Using Docker Containers
- Docker : NodeJS with GCP Kubernetes Engine
- Docker : Jenkins Multibranch Pipeline with Jenkinsfile and Github
- Docker : Jenkins Master and Slave
- Docker - ELK : ElasticSearch, Logstash, and Kibana
- Docker - ELK 7.6 : Elasticsearch on Centos 7
- Docker - ELK 7.6 : Filebeat on Centos 7
- Docker - ELK 7.6 : Logstash on Centos 7
- Docker - ELK 7.6 : Kibana on Centos 7
- Docker - ELK 7.6 : Elastic Stack with Docker Compose
- Docker - Deploy Elastic Cloud on Kubernetes (ECK) via Elasticsearch operator on minikube
- Docker - Deploy Elastic Stack via Helm on minikube
- Docker Compose - A gentle introduction with WordPress
- Docker Compose - MySQL
- MEAN Stack app on Docker containers : micro services
- MEAN Stack app on Docker containers : micro services via docker-compose
- Docker Compose - Hashicorp's Vault and Consul Part A (install vault, unsealing, static secrets, and policies)
- Docker Compose - Hashicorp's Vault and Consul Part B (EaaS, dynamic secrets, leases, and revocation)
- Docker Compose - Hashicorp's Vault and Consul Part C (Consul)
- Docker Compose with two containers - Flask REST API service container and an Apache server container
- Docker compose : Nginx reverse proxy with multiple containers
- Docker & Kubernetes : Envoy - Getting started
- Docker & Kubernetes : Envoy - Front Proxy
- Docker & Kubernetes : Ambassador - Envoy API Gateway on Kubernetes
- Docker Packer
- Docker Cheat Sheet
- Docker Q & A #1
- Kubernetes Q & A - Part I
- Kubernetes Q & A - Part II
- Docker - Run a React app in a docker
- Docker - Run a React app in a docker II (snapshot app with nginx)
- Docker - NodeJS and MySQL app with React in a docker
- Docker - Step by Step NodeJS and MySQL app with React - I
- Installing LAMP via puppet on Docker
- Docker install via Puppet
- Nginx Docker install via Ansible
- Apache Hadoop CDH 5.8 Install with QuickStarts Docker
- Docker - Deploying Flask app to ECS
- Docker Compose - Deploying WordPress to AWS
- Docker - WordPress Deploy to ECS with Docker-Compose (ECS-CLI EC2 type)
- Docker - WordPress Deploy to ECS with Docker-Compose (ECS-CLI Fargate type)
- Docker - ECS Fargate
- Docker - AWS ECS service discovery with Flask and Redis
- Docker & Kubernetes : minikube
- Docker & Kubernetes 2 : minikube Django with Postgres - persistent volume
- Docker & Kubernetes 3 : minikube Django with Redis and Celery
- Docker & Kubernetes 4 : Django with RDS via AWS Kops
- Docker & Kubernetes : Kops on AWS
- Docker & Kubernetes : Ingress controller on AWS with Kops
- Docker & Kubernetes : HashiCorp's Vault and Consul on minikube
- Docker & Kubernetes : HashiCorp's Vault and Consul - Auto-unseal using Transit Secrets Engine
- Docker & Kubernetes : Persistent Volumes & Persistent Volumes Claims - hostPath and annotations
- Docker & Kubernetes : Persistent Volumes - Dynamic volume provisioning
- Docker & Kubernetes : DaemonSet
- Docker & Kubernetes : Secrets
- Docker & Kubernetes : kubectl command
- Docker & Kubernetes : Assign a Kubernetes Pod to a particular node in a Kubernetes cluster
- Docker & Kubernetes : Configure a Pod to Use a ConfigMap
- AWS : EKS (Elastic Container Service for Kubernetes)
- Docker & Kubernetes : Run a React app in a minikube
- Docker & Kubernetes : Minikube install on AWS EC2
- Docker & Kubernetes : Cassandra with a StatefulSet
- Docker & Kubernetes : Terraform and AWS EKS
- Docker & Kubernetes : Pods and Service definitions
- Docker & Kubernetes : Service IP and the Service Type
- Docker & Kubernetes : Kubernetes DNS with Pods and Services
- Docker & Kubernetes : Headless service and discovering pods
- Docker & Kubernetes : Scaling and Updating application
- Docker & Kubernetes : Horizontal pod autoscaler on minikubes
- Docker & Kubernetes : From a monolithic app to micro services on GCP Kubernetes
- Docker & Kubernetes : Rolling updates
- Docker & Kubernetes : Deployments to GKE (Rolling update, Canary and Blue-green deployments)
- Docker & Kubernetes : Slack Chat Bot with NodeJS on GCP Kubernetes
- Docker & Kubernetes : Continuous Delivery with Jenkins Multibranch Pipeline for Dev, Canary, and Production Environments on GCP Kubernetes
- Docker & Kubernetes : NodePort vs LoadBalancer vs Ingress
- Docker & Kubernetes : MongoDB / MongoExpress on Minikube
- Docker & Kubernetes : Load Testing with Locust on GCP Kubernetes
- Docker & Kubernetes : MongoDB with StatefulSets on GCP Kubernetes Engine
- Docker & Kubernetes : Nginx Ingress Controller on Minikube
- Docker & Kubernetes : Setting up Ingress with NGINX Controller on Minikube (Mac)
- Docker & Kubernetes : Nginx Ingress Controller for Dashboard service on Minikube
- Docker & Kubernetes : Nginx Ingress Controller on GCP Kubernetes
- Docker & Kubernetes : Kubernetes Ingress with AWS ALB Ingress Controller in EKS
- Docker & Kubernetes : Setting up a private cluster on GCP Kubernetes
- Docker & Kubernetes : Kubernetes Namespaces (default, kube-public, kube-system) and switching namespaces (kubens)
- Docker & Kubernetes : StatefulSets on minikube
- Docker & Kubernetes : RBAC
- Docker & Kubernetes Service Account, RBAC, and IAM
- Docker & Kubernetes - Kubernetes Service Account, RBAC, IAM with EKS ALB, Part 1
- Docker & Kubernetes : Helm Chart
- Docker & Kubernetes : My first Helm deploy
- Docker & Kubernetes : Readiness and Liveness Probes
- Docker & Kubernetes : Helm chart repository with Github pages
- Docker & Kubernetes : Deploying WordPress and MariaDB with Ingress to Minikube using Helm Chart
- Docker & Kubernetes : Deploying WordPress and MariaDB to AWS using Helm 2 Chart
- Docker & Kubernetes : Deploying WordPress and MariaDB to AWS using Helm 3 Chart
- Docker & Kubernetes : Helm Chart for Node/Express and MySQL with Ingress
- Docker & Kubernetes : Deploy Prometheus and Grafana using Helm and Prometheus Operator - Monitoring Kubernetes node resources out of the box
- Docker & Kubernetes : Deploy Prometheus and Grafana using kube-prometheus-stack Helm Chart
- Docker & Kubernetes : Istio (service mesh) sidecar proxy on GCP Kubernetes
- Docker & Kubernetes : Istio on EKS
- Docker & Kubernetes : Istio on Minikube with AWS EC2 for Bookinfo Application
- Docker & Kubernetes : Deploying .NET Core app to Kubernetes Engine and configuring its traffic managed by Istio (Part I)
- Docker & Kubernetes : Deploying .NET Core app to Kubernetes Engine and configuring its traffic managed by Istio (Part II - Prometheus, Grafana, pin a service, split traffic, and inject faults)
- Docker & Kubernetes : Helm Package Manager with MySQL on GCP Kubernetes Engine
- Docker & Kubernetes : Deploying Memcached on Kubernetes Engine
- Docker & Kubernetes : EKS Control Plane (API server) Metrics with Prometheus
- Docker & Kubernetes : Spinnaker on EKS with Halyard
- Docker & Kubernetes : Continuous Delivery Pipelines with Spinnaker and Kubernetes Engine
- Docker & Kubernetes : Multi-node Local Kubernetes cluster : Kubeadm-dind (docker-in-docker)
- Docker & Kubernetes : Multi-node Local Kubernetes cluster : Kubeadm-kind (k8s-in-docker)
- Docker & Kubernetes : nodeSelector, nodeAffinity, taints/tolerations, pod affinity and anti-affinity - Assigning Pods to Nodes
- Docker & Kubernetes : Jenkins-X on EKS
- Docker & Kubernetes : ArgoCD App of Apps with Heml on Kubernetes
- Docker & Kubernetes : ArgoCD on Kubernetes cluster
- Docker & Kubernetes : GitOps with ArgoCD for Continuous Delivery to Kubernetes clusters (minikube) - guestbook
Ph.D. / Golden Gate Ave, San Francisco / Seoul National Univ / Carnegie Mellon / UC Berkeley / DevOps / Deep Learning / Visualization